When the numbers calm down before you do
The second phase of a crash, and what a quieter heart-rate number can mean mid-crash
A look through our own community's data and the published research on post-exertional malaise, on what a calmer number can mean when the body that produced it has not recovered.
Prepared 2026 · R&D analysis · descriptive, per-user normalized · not a substitute for medical advice
Community question, group case
Several of us have noticed the same two-part pattern after overexertion. First a classic crash: symptoms worse, resting and active heart rate up, more heart-rate spikes, more time flagged as physiologic stress, nervous system balance leaning sympathetic, sometimes a low-grade fever. Then, while still deep in the crash and nowhere near recovered, the numbers turn around: lower resting and active heart rate, smaller heart-rate spikes, calmer-looking nervous system readings.
No energy today
Read only this
The two-phase pattern is real in our own community's data. Right around a crash, resting heart rate runs high. Some time later, still in the same crash, resting heart rate drops and heart rate variability (HRV) rises.
A calmer number does not mean a calmer body. Every mechanism behind this shift, in the published research, describes a system with less left to give, not one that recovered.
It's a direction, not a rule. In our data the reversal shows up in most crash episodes, but the size and timing vary a lot from person to person.
Short answer: The published explanations of calmer-looking numbers mid-crash all point the same direction: less capacity left to react, not a system that has recovered. It's worth reading these numbers the same way many of us already read a good number early in a crash, as a brake, not a green light, whichever direction it's pointing.
What comes up across our community
Where this question starts
We checked what our own data shows about that reversal, and what published research on myalgic encephalomyelitis/chronic fatigue syndrome (ME/CFS) and Long COVID says about why a body that hasn't recovered can still produce calmer numbers.
Step 1
What our own data shows
We pulled every day tagged as a crash in the community journal — crash, chronic illness crash, ME Crash, PEM, mini crash — logged between May 2026 and July 2026: 311 tagged days from 33 members. Every value below is checked only against that person's own history. We never compare one member's numbers to another's.
Averaged across everyone, there's no single clean spike-then-drop shape. That's expected: crashes start at different points and last different lengths of time for different people, and a self-logged crash-day tag isn't pinned to an exact physiological low. Averaging blurs a swing that's genuinely there for many individual crashes.
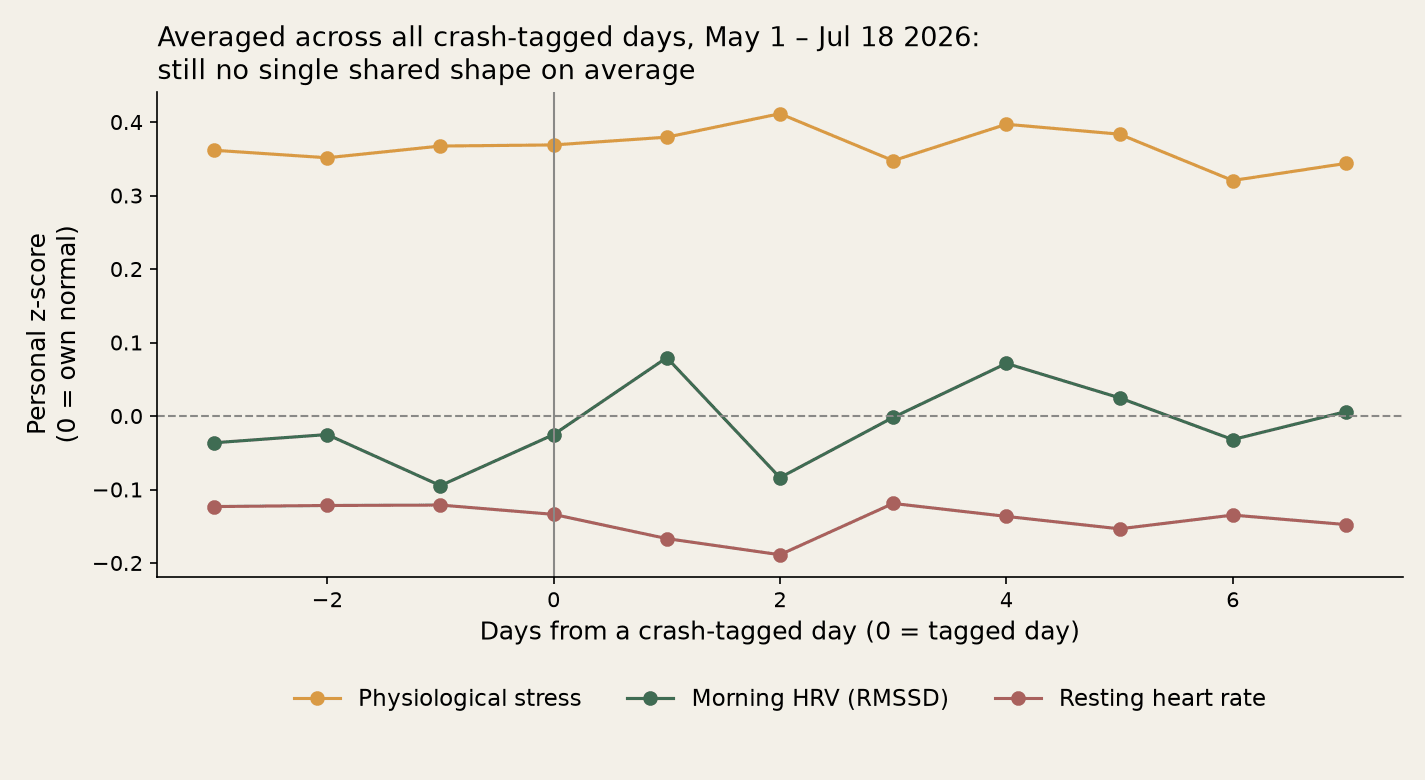
Looking event by event tells a clearer story. For each crash, we compared a member's own highest resting heart rate in the first two days against their own lowest point two to five days later, and did the same for morning HRV.
Resting heart rate. The later reading fell below the early peak in 82.5% of events. Median drop is 0.47 standard deviations. We can see a consistent within-person pattern - nearly every member's RHR drops and heart rate variability rises in the days after a crash is tagged.
How often does resting HR fall below normal after the early spike?
(n = 291 crash events, 34 members — May 1 to Jul 18, 2026)
| Range | crash events |
|---|---|
| -1 to -0.8 | 2 |
| -0.8 to -0.6 | 2 |
| -0.6 to -0.4 | 5 |
| -0.4 to -0.2 | 16 |
| -0.2 to 0 | 22 |
| 0 to 0.2 | 37 |
| 0.2 to 0.4 | 44 |
| 0.4 to 0.6 | 46 |
| 0.6 to 0.8 | 37 |
| 0.8 to 1 | 21 |
| 1 to 1.2 | 22 |
| 1.2 to 1.4 | 15 |
| 1.4 to 1.6 | 6 |
| 1.6 to 1.8 | 8 |
| 1.8 to 2 | 2 |
| 2 to 2.2 | 2 |
| 2.2 to 2.4 | 1 |
| 2.4 to 2.6 | 0 |
| 2.6 to 2.8 | 1 |
Heart rate variability, using the underlying RMSSD reading from each member's earliest wearable measurement of the morning, not the app's daily HRV score, which caps out at a ceiling on a majority of mornings and would have hidden part of this effect. 287 crash events, 36 members. HRV was higher in the later window than the early one in 89.2% of events. Median rise is 1.24 standard deviation. That's a consistent within-person pattern.
Does HRV (vagal tone) look 'better' later in a crash?
(n = 287 events, 36 members — May 1 to Jul 18, 2026)
| Range | crash events |
|---|---|
| -3 to -2.5 | 2 |
| -2.5 to -2 | 0 |
| -2 to -1.5 | 4 |
| -1.5 to -1 | 3 |
| -1 to -0.5 | 10 |
| -0.5 to 0 | 12 |
| 0 to 0.5 | 32 |
| 0.5 to 1 | 52 |
| 1 to 1.5 | 57 |
| 1.5 to 2 | 48 |
| 2 to 2.5 | 26 |
| 2.5 to 3 | 16 |
| 3 to 3.5 | 6 |
| 3.5 to 4 | 5 |
| 4 to 4.5 | 3 |
| 4.5 to 5 | 2 |
| 5 to 5.5 | 5 |
| 5.5 to 6 | 2 |
| 6 to 6.5 | 1 |
| 6.5 to 7 | 1 |
Step 2
Why a calmer number doesn't mean a calmer body
Different separately documented mechanisms, mostly from ME/CFS and Long COVID research, describe a nervous system and cardiovascular system with less capacity to react.
A blunted heart-rate response to effort (chronotropic incompetence). Several recent Long COVID studies describe the heart simply not speeding up as much for the same effort. In ME/CFS, this shows up most clearly on the second day of repeated exercise testing: after the first day already triggered post-exertional malaise, the heart-rate rise for identical effort is smaller, even though perceived exertion is higher.
A nervous system is slower to reset after effort. Case-control research comparing people with ME/CFS to healthy participants after exercise found reduced parasympathetic reactivation, the calm-down branch of the nervous system reactivating more slowly during recovery (Van Oosterwijck J, et al., 2021).
A flattened stress-hormone response. A widely cited review of the hypothalamic-pituitary-adrenal (HPA) axis in chronic fatigue syndrome describes a blunted, flattened cortisol response (Papadopoulos AS, Cleare AJ., 2012). Our hypothesis is the following: a system that already spent its hormonal push once often can't mount the same response again so soon. A quieter reading the second time can reflect that flattening rather than recovery.
Phase 1 - Alarm
(around the crash)
Sympathetic surge
Resting/active HR up
More time in physiologic stress
Possible low-grade fever
Phase 2 - Blunted, not recovered
(numbers read calmer)
Blunted HR response (chronotropic incompetence)
Heart can't raise output - preload/stroke-volume limit
Slower parasympathetic reactivation after effort
Flattened cortisol / HPA-axis response
Same nervous system, less capacity left to react - not a system that has recovered.
Step 3
Is this an officially recognized pattern
We didn't find a study describing this exact two-phase shape as a single, validated syndrome specific to ME/CFS, Long COVID, or POTS (postural orthostatic tachycardia syndrome). What's documented, separately and in peer-reviewed research, are the individual pieces above. Put together, they build a plausible, evidence-grounded account of why the second phase reads calmer. That's an interpretation built from separate findings, not one confirmed mechanism with its own name.
The answer
The published explanations of calmer-looking numbers mid-crash all point the same direction: less capacity left to react, not a system that has recovered. It's worth reading these numbers the same way many of us already read a good number early in a crash, as a brake, not a green light, whichever direction it's pointing.
Further reading
- 1.Keller BA, Pryor JL, Giloteaux L (2014). "Inability of myalgic encephalomyelitis/chronic fatigue syndrome patients to reproduce VO₂peak indicates functional impairment." J Transl Med 12:104. doi.org/10.1186/1479-5876-12-104
- 2.Durstenfeld, Matthew S., et al. "Reduced exercise capacity, chronotropic incompetence, and early systemic inflammation in cardiopulmonary phenotype long coronavirus disease 2019." The Journal of Infectious Diseases 228.5 (2023): 542-554.
- 3.Van Oosterwijck J, et al. (2021). Reduced Parasympathetic Reactivation during Recovery from Exercise in Myalgic Encephalomyelitis/Chronic Fatigue Syndrome. J Clin Med, 10(19), 4527. — https://www.mdpi.com/2077-0383/10/19/4527
- 4.Papadopoulos AS, Cleare AJ. (2012). Hypothalamic-pituitary-adrenal axis dysfunction in chronic fatigue syndrome. Nature Reviews Endocrinology, 8(1), 22-32. — https://doi.org/10.1038/nrendo.2011.153
- 5.Manresa-Rocamora A, et al. (2021). Heart rate-based indices to detect parasympathetic hyperactivity in functionally overreached athletes: a meta-analysis. Scand J Med Sci Sports, 31(6), 1164-1182. — https://doi.org/10.1111/sms.13932
- 6.Wust RCI, et al. (2025). Wearable heart-rate-variability monitoring identifies autonomic dysfunction and thresholds for post-exertional malaise in Long COVID. medRxiv preprint. — https://doi.org/10.1101/2025.03.18.25320115
- 7.Workwell Foundation, pacing with a heart-rate monitor to reduce post-exertional malaise. — https://workwellfoundation.org/pacing-with-a-heart-rate-monitor-to-minimize-post-exertional-malaise-pem-in-me-cfs-and-long-covid/
General information from our community's data, not a substitute for medical advice.