The calorie number on your watch, and how much you actually need to eat
Why “calories burned” can mislead a body with POTS, ME/CFS, or Long COVID — and what to use instead
A research summary for the ELC Community
Many of us know this from the inside. Hunger and thirst do not show up until it is too late and the sick feeling is already here — so the “calories burned” number on the phone becomes the thing we steer by. On a busier day it can jump near 1,000 in two hours, and the worry lands: maybe that number is the real one, maybe there has been under-eating all along.
Two questions hide in one, and the science answers both cleanly.
Can the “calories burned” figure be trusted — no. A watch does not measure energy; it predicts it, with a very large margin of error (the studies are in Part 2). It is not a sound basis for deciding how much to eat.
Whether you are eating enough — the only way to know is the trend of your body weight over time. If it holds steady, you are eating about what your body needs. If it drifts down, it is too little. A single day’s numbers — eaten or burned — cannot answer this, because energy balance plays out over days, not in the moment (buffering by medications, glycogen and fluid, together with the slow kinetics of meaningful changes in fat mass and muscle mass).
This document explains why, and what to use instead. It draws on peer-reviewed research, manufacturer documentation, and a look at our own community’s de-identified data. Where the evidence is strong, we say so. Where it is missing, we say that too. Nothing here is medical advice, and the practical parts are written for review by our medical lead before anyone acts on them.
Part 1 — The question
The loop “I burned X, so I can eat X” feels intuitive, but it does not reliably work for anyone — energy balance is a multi-day balance, not a moment-to-moment one. For a body with an energy-limiting condition both ends of the loop are even shakier, and leaning on the burn number can quietly push intake too low.
This is not a small risk. Though only a conference abstract rather than a full study, a 2024 comparison found people with ME/CFS reported eating less energy, protein, and carbohydrate than healthy controls, with several eating below their own resting requirement (Liljebo & Andreasson, 2024). In Long COVID, suppressed appetite and reduced intake are common enough that malnutrition risk tracks with worse symptoms (review, 2026; malnutrition risk). When the usual signals — hunger, thirst, “listen to your body” — are blunted, the device number fills the vacuum. So it is worth being clear about what that number is, and is not.
Part 2 — The theory: why the number is shaky
2.1 Your watch does not measure calories — it guesses
No wrist or finger wearable measures energy. The only accurate way is indirect calorimetry, which captures the oxygen you breathe in and the carbon dioxide you breathe out (overview). A watch instead makes a probability estimate from two things it can sense — your heart rate and your movement — combined with your age, height, weight, and sex.
It splits the day into your resting burn (the energy to stay alive at rest, usually most of the total) and your active burn. The resting part comes from a standard equation (Mifflin–St Jeor, 1990). The active part leans heavily on heart rate as a stand-in for effort, because heart rate is cheap to read and, in healthy bodies, rises roughly in step with energy use. Some devices also blend in movement sensors, an approach documented in manufacturer patents (example).
Even in healthy people this is rough. When Stanford tested seven popular wearables against laboratory measurement, every one measured heart rate well but got energy expenditure wrong — the most accurate was off by about 27%, the least by 93% (Shcherbina et al., 2017; Stanford summary). A broader review found energy errors above 30% across brands (review). The heart-rate reading is the trustworthy part. The calorie number is the weak link.
2.2 It misfires both ways — and the reason barely matters
In healthy bodies the watch already errors in both directions. The same high pulse shows up for arm work and leg work, yet legs cost far more energy. And effortful leg work done sitting or lying can spend real energy while the pulse barely rises. The device is reading a proxy, not the thing itself.
In autonomic dysfunction the gap widens, in two opposite directions.
Every calorie algorithm assumes: higher heart rate = more energy used
In autonomic dysfunction that assumption breaks — in two opposite directions
POTS / dysautonomia
→ OVER-counts calories
Trigger: standing up
(postural change, minimal exertion)
Heart rate jumps +30–50 bpm
to push blood up against gravity, not because of real exercise
Watch sees a high heart rate
and reads it as "hard exercise"
OVER-counts calories
Example: device logs 180 kcal for 10 min of just standing up
ME / CFS
→ UNDER-counts calories
Trigger: real exertion
(walking, climbing stairs)
Heart rate barely rises
+ muscles extract less oxygen than they should
Watch sees a modest heart rate
and reads it as "light effort"
UNDER-counts calories
Example: device logs 40 kcal for a walk that exhausted them
Both conditions break the same assumption — but in opposite directions
With POTS or dysautonomia, standing up — and staying upright — makes the heart race by 30 or more beats per minute to push blood against gravity, not because muscles are working (POTS exercise intolerance, 2026). During those upright periods the watch can read a “workout” pulse while little real energy is spent, and the calorie figure inflates. With ME/CFS the link breaks the other way: muscles extract less oxygen than they should and the heart pumps more for less usable energy (Vermeulen et al.), and the heart often cannot lift its rate normally under load (two-day exercise testing review) — so a modest pulse hides a costly effort and the figure under-reads.
The deeper point is simpler than any single mechanism: a watch is not a measuring instrument for energy. It reports an averaged guess, and the guess can land anywhere. The reasons it lands wrong — posture, which limbs are working, whether you did any exercise and in what position, room temperature, humidity — are many, and you cannot correct for them. (The cellular low-power picture in ME/CFS is described by Naviaux et al., 2016; the two-day test once used to prove is still reliable, but has had mixed replication — Mancini et al., 2026.)
Another big confounder is medication. People with POTS often take heart-rate-lowering agents - low-dose beta-blockers, or ivabradine, a selective sinoatrial-node inhibitor that slows heart rate without beta-blockade (Taub et al., 2021). Both lower heart rate at rest and during exertion. Because a heart-rate-based algorithm calibrated in untreated people reads a lower rate as lower expenditure, it may underestimate actual energy use. In treated POTS, two opposing distortions can act at once: orthostatic tachycardia raises heart rate on standing (overestimation), while medication lowers it across the day (underestimation). Which dominates depends on agent, dose, posture, and activity, and can't be predicted reliably at the individual level.
2.3 How wrong, in numbers
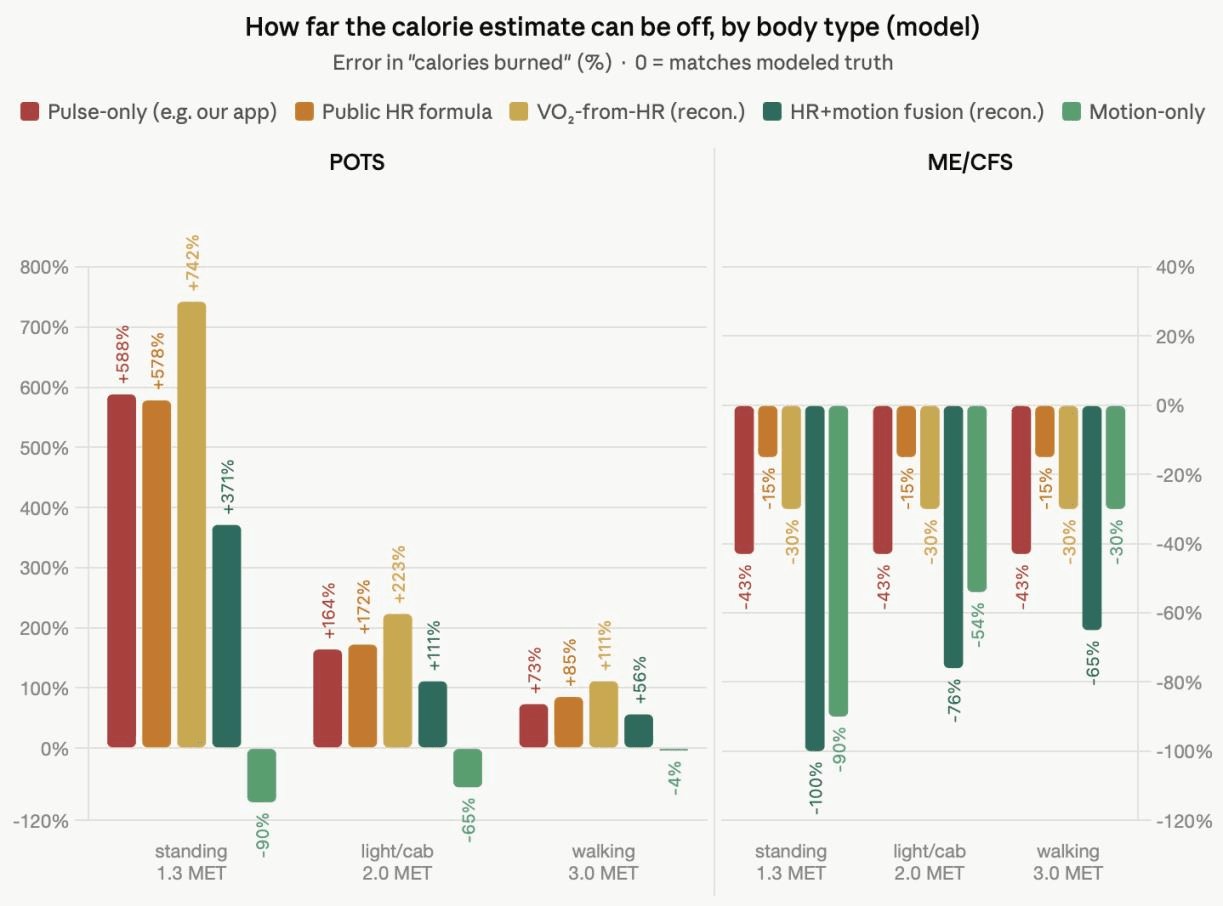
The practical headline: in a POTS-type body, standing and postural changes can add several hundred “calories burned” that were never really spent; in an ME/CFS-type body, a costly day can read as a light one. No device is simply “accurate” — and PEM itself is invisible to all of them, because the cost of today’s effort often lands a day or two later and cognitive effort costs energy no movement sensor sees.
2.4 The reframe
Chasing a better “calories burned” number is the wrong goal — the watch cannot see what you spent. The honest way to know whether you are eating enough is not a daily figure at all: it is the trend of your body weight over a week or two. Steady weight means your intake matches your needs; a downward drift means it does not.
Part 3 — The practice: what to anchor on instead
3.1 A starting estimate from your needs — checked against your weight
To get a rough number to start from, the classic approach is your resting requirement multiplied by an activity factor — the framework in the FAO/WHO/UNU energy requirements report (2001). Three things make it usable here:
- A floor. Your resting requirement is the energy your body uses just to stay alive. Eating below it for long stretches is the pattern linked to muscle loss and a slowing metabolism. It works as a “not below this” line. Please note, that standard basal-metabolism formulas are derived from the general population and may not hold in ELC, where exertion might call for different energy costs and increased micro-, and macronutrient needs.
Note on protein intake: Protein intake is worth watching alongside weight, since weight alone may not reflect it. Under-eating protein appears common here: a 2025 scoping review of 50 Long COVID nutrition studies found recovering patients reached a median of only ~77% of their protein needs (scoping review, 2025). Ensuring adequate protein is also a reasonable focus.
- An activity factor from time-in-positions, not pulse. Watches already track how long you spend asleep, sitting or lying, moving lightly, and active. Adding up that time — with no heart rate involved — gives a personal factor that orthostatic tachycardia cannot inflate. In our data it sits around 1.3–1.45, a reasonable starting point.
- A buffer upward. Because under-eating is the more dangerous mistake here, the target has room at the top, and on harder days the move that tends to help is eating more, not less.
But a calculated number is only a starting point. People misjudge how much they actually eat — drinks especially are easy to miss — so no estimate is the standard. In many cases the standard is your weight. But that approach also carries an important limitation in this population, worth understanding. Many people with POTS intentionally increase salt and fluid intake, and menstrual-cycle variation and glycogen-related water shifts add further noise to day-to-day fluctuations. This is why, in the literature, weight-based approaches emphasize longer observation and standardized conditions — for example, a seven-day rolling average tracked over about four weeks, with measurements taken under consistent conditions (same time of day, fasting state, same scale). The general principle is that an averaged trend over several weeks carries more signal than any single reading, single week, or formula — precisely because it smooths out the fluid-related noise that shorter windows can't separate from real change.
3.2 “If you look like this” — patterns in our community
This table is about not under-fueling. The numbers are a rough floor — a minimum to try not to fall below — not a goal to “eat up to,” and not a weight-loss or weight-gain plan. Any intentional change in body weight is a separate conversation, best had with a clinician. Whatever your size, the real check stays the same: your weight over a week or two.
We looked at de-identified data from 79 community members (all women; figures shown only for groups large enough to protect privacy). Find your row by daily steps first; in the middle step range, weight separates the two. Each range is the middle 80% of that group.
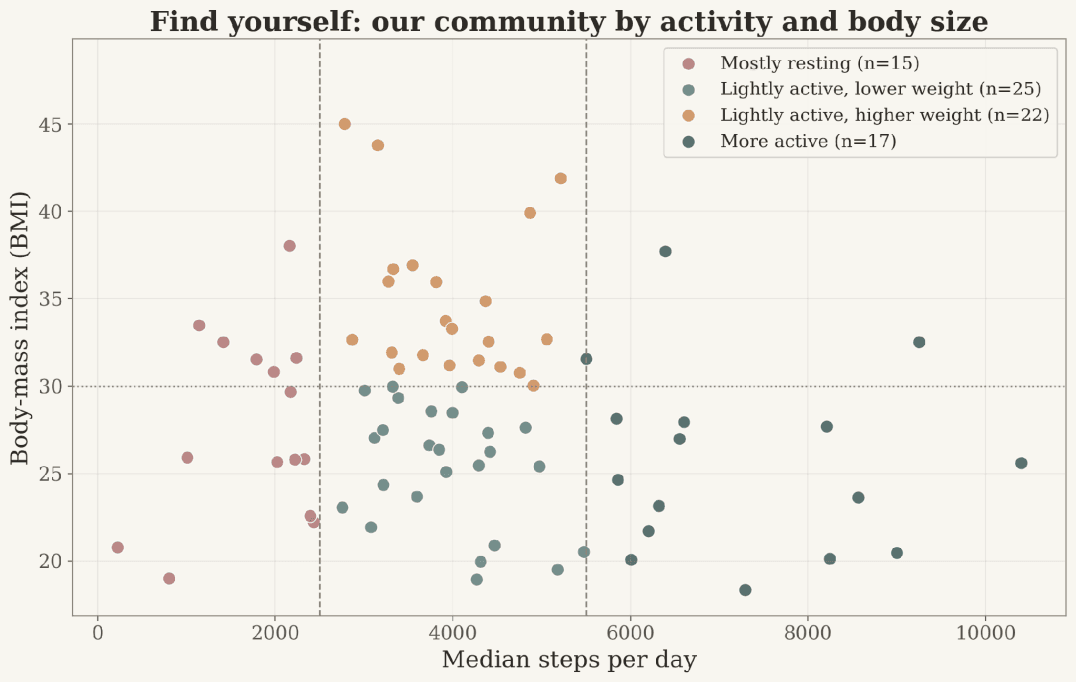
- Your typical pattern · Steps/day · Weight · Height · Age · Rough floor*
- Mostly resting · 900–2,400 · 54–88 kg · 153–169 cm · 41–63 · 1,470–1,800
- Lightly active, lower body weight (BMI <30) · 3,100–4,900 · 55–85 kg · 157–174 cm · 43–65 · 1,630–1,930
- Lightly active, higher body weight (BMI ≥30) · 3,200–4,900 · 83–116 kg · 160–172 cm · 46–64 · (see note)
- More active · 5,900–9,100 · 56–102 kg · 160–173 cm · 38–60 · 1,720–2,340
*A rough minimum from size and movement, never below your resting requirement (~1,300–1,500 for most of us), not a target to eat up to. Group sizes ~15 / ~25 / ~22 / ~17. Reviewed by our medical lead before use; your own exact number is best computed individually, then checked against your weight trend.
Note on higher body weight (BMI ≥30): a resting-requirement formula based on total weight tends to over-state need when much of the weight is not lean tissue, so a single floor number here would be misleading. For this group the estimate is better anchored on adjusted or optimal-for-height weight, and — again — read through the weight-trend check rather than a fixed figure. Under-fueling is still harmful at a higher body weight (it still costs muscle), so the goal of not under-eating applies; the number just needs an individual calculation, and any deliberate weight change belongs with a clinician.
3.3 Why your watch cannot tell you your type
The need-estimate (size plus movement) we can produce for everyone. But the direction your watch errs — over-counting (POTS-type) or under-counting (ME/CFS-type) — we could not recover from passive daily data. When we tried, the everyday signals did not separate the groups; in our data the POTS-type members even had lower resting heart rates and more steps than the ME/CFS-type members. That fits the biology: the orthostatic effect lives in the lying-to-standing change, which a daily summary never captures.
That direction can only come from your own diagnosis, or from a brief lying-to-standing heart-rate check — one minute lying down, ten minutes standing — the kind of orthostatic test used in clinics and gently at home through groups like the Bateman Horne Center.
3.4 What to track instead of “calories burned”
The single indicator that matters is what your weight does over 7–10 days. The watch’s calorie number is not worth steering by: its error is large and shifts with your medication, posture, whether you did any exercise and in what position, and even room temperature and humidity. Beyond that:
- Read your pulse as strain, not as fuel — a high standing or activity heart rate is a useful “ease off” signal for pacing, not a measure of energy spent.
- Notice the “am I eating enough” signs — no faintness or weakness between meals, no sharp dip in clarity a couple of hours after eating.
- Eating on a schedule tends to work better than waiting for hunger when the hunger signal itself is unreliable.
Part 4 — What we are building, and a lab round you can join
We can already run the needs-based estimate on each member’s own data and produce a personal starting band, a “not below this” floor, and a flag if weight is drifting down. What it does not yet have is the missing direction — whether your particular watch over- or under-reads — and a version tuned to your physiology.
An invitation, not a task. If at least 20 of us are willing to do a simple orthostatic check (a one-minute-lying, ten-minute-standing heart-rate measurement, done at home, opt-in, with the freedom to stop any time it does not feel okay), we will run a lab round to try to build a more individual fueling estimate — one that combines your size, your time-in-positions, your weight trend over the months, and your orthostatic response into something made for your body rather than an average one.
It would be a community observation, not a trial, and not a medical device — a shared experiment in reading our own data better. Quiet weeks count too; there is no pressure to join, and skipping it changes nothing else. If it speaks to you, there will be a simple way to raise your hand.
A note on the numbers
The community figures come from de-identified group data (79 members, current to mid-2026), shown only for groups large enough to protect identity. The error sizes are from a transparent, illustrative model with stated assumptions, not from measuring anyone’s true energy. The activity-factor values are literature defaults still being tuned for our community. Everything with a clinical or nutritional implication is going through our medical lead before it becomes guidance. None of this is medical advice; for your own situation, a registered dietitian experienced with chronic illness is the right partner.
References
- 1.Liljebo & Andreasson (2024). Nutrition intake in ME/CFS vs healthy controls. *Canadian Journal of Dietetic Practice and Research.* https://www.s4me.info/threads/nutrition-intake-in-patient-with-me-cfs-compared-to-healthy-controls-2024-liljebo.40876/
- 2.Impact of nutrition on Long COVID (2026). *PMC.* https://pmc.ncbi.nlm.nih.gov/articles/PMC12926324/
- 3.Nutritional risk and malnutrition after COVID-19. *PMC.* https://www.ncbi.nlm.nih.gov/pmc/articles/PMC8839070/
- 4.Indirect calorimetry in clinical practice. *PMC.* https://pmc.ncbi.nlm.nih.gov/articles/PMC6780066/
- 5.Mifflin–St Jeor (1990). Predictive equation for resting energy expenditure. *Am J Clin Nutr.* https://pubmed.ncbi.nlm.nih.gov/2305711/
- 6.FAO/WHO/UNU (2001). Human Energy Requirements (physical activity levels). https://www.fao.org/4/y4249e/y4249e0j.htm
- 7.Shcherbina et al. (2017). Accuracy of wrist heart rate and energy expenditure. *J Pers Med.* https://pmc.ncbi.nlm.nih.gov/articles/PMC5491979/
- 8.Stanford summary (2017): trackers measure heart rate well, calories poorly. https://med.stanford.edu/news/all-news/2017/05/fitness-trackers-accurately-measure-heart-rate-but-not-calories-burned.html
- 9.Wrist-wearable accuracy — energy expenditure error >30%. *PubMed.* https://pubmed.ncbi.nlm.nih.gov/35060915/
- 10.Sensor-fusion energy estimation (example patent, US9918646B2). https://patents.google.com/patent/US9918646B2
- 11.Exercise intolerance in POTS — systematic review (2026). *PMC.* https://pmc.ncbi.nlm.nih.gov/articles/PMC12680087/
- 12.Energy cost of standing vs sitting. *PMC.* https://www.ncbi.nlm.nih.gov/pmc/articles/PMC3669211/
- 13.Vermeulen et al. Reduced oxygen extraction during exercise in CFS. *PMC.* https://pmc.ncbi.nlm.nih.gov/articles/PMC3903040/
- 14.Two-day cardiopulmonary exercise testing in ME/CFS (review). *PMC.* https://pmc.ncbi.nlm.nih.gov/articles/PMC11229500/
- 15.Mancini et al. (2026). CPET across two sequential days in CFS. *Frontiers in Physiology.* https://www.frontiersin.org/journals/physiology/articles/10.3389/fphys.2026.1816082/full
- 16.Naviaux et al. (2016). Metabolic features of CFS. *PNAS.* https://www.pnas.org/doi/10.1073/pnas.1607571113
- 17.Taub PR, et al. (2021). Randomized Trial of Ivabradine in Patients With Hyperadrenergic Postural Orthostatic Tachycardia Syndrome. *JACC.* https://www.jacc.org/doi/10.1016/j.jacc.2020.12.029
- 18.Bateman Horne Center — orthostatic (NASA Lean) testing & energy-management resources. https://batemanhornecenter.org/
Where a claim rests on the absence of evidence — for example, that no published study has validated a single calorie algorithm in people with ME/CFS or POTS — we say so plainly. That gap is itself part of why this lab round is worth running.