The science of PEM crashes
What we know, what we don't, and what your data can teach us
A research summary for the ELC Community — written for humans, grounded in evidence
If you live with post-exertional malaise (PEM), you already know more about crashes than most doctors. You know that a good day can be followed by a terrible one. You know that "just a short walk" can cost you two days. You know that the standard advice — "listen to your body" — doesn't work when your body lies to you. You know that there can be different kinds of triggers for PEM, physical and cognitive.
This document summarizes what science actually knows about PEM crashes as of mid-2026. Some of it will confirm what you've experienced. Some of it will surprise you. And some of the most commonly repeated advice in the myalgic encephalomyelitis/chronic fatigue syndrome ME/CFS and Long Covid communities turns out to have no published evidence behind it at all.
Everything here comes from peer-reviewed research, clinical observations, and patient-tracked data. Where evidence is strong, we say so. Where it's missing, we say that too. No spin.
Part 1 — What actually happens in your body during a crash
When you exert beyond your energy window, your body doesn't just get tired — it launches a measurable immune and metabolic response. PEM is not simply fatigue. It's inflammation.
It was found that in people with ME/CFS, moderate exercise triggers abnormally sustained increases in immune and sympathetic nervous system gene expression lasting 24–48 hours after exertion — a pattern not observed in healthy individuals in the comparison group. (White AT, Light AR et al., 2012)
0–4 hours
IL-6 spikes
NK cell function drops
4–24 hours
Gene expression shifts
Autonomic stress mode
24–48 hours
Symptoms hit (crash)
Genes still altered
48–72 hours
PGE2 still elevated
Metabolic recovery slow
3–5 days
PGE2 may persist
Full recovery ongoing
Time after overexertion
Meanwhile, your mitochondria appear to be stuck in a low-power mode. Research from Robert Naviaux's lab at UC San Diego found a distinct hypometabolic signature in ME/CFS, similar to the hibernation response some organisms use when threatened (Naviaux et al., 2016), which is also true for Long Covid (Appelman et al., 2024). When you crash, your body isn't just tired — it's in a kind of metabolic lockdown.
Lag time between activity spikes and crashes
One of the most common narratives is: "I overdid it three days ago and now I'm paying for it."
The biological evidence supports a 1-3 day delay — that part is real. But when Dr. Athanasia Mowinckels tracked her own crashes quantitatively over 2 years using the Visible app (14 crash events with daily biometric data), a different pattern emerged: the biggest activity spike was consistently one day before the crash, not three (Mowinckels, 2026, drmowinckels.io — independent longitudinal self-tracking analysis).
Day −3
Normal activity
Day −2
Normal activity
“Feels fine or great”
Day −1
Activity spike +30% above baseline
Day 0
CRASH
Activity drops 40%
Day +1 to +5
Recovery
PGE2 still elevated
This is worth checking: if you're going to watch for danger spike signals, yesterday might be more likely to have signals than three days ago. However, this observation may not apply to everyone,
Multi-day activity accumulation contributes to PEM risk — a principle recognized in clinical guidelines and the Energy Envelope framework (Jason et al., 2013). The energy envelope is the daily limit of activity your body can handle without triggering a crash.
That said, multi day activity totals predict crashes better than any single day. Think of your energy as a weekly budget, not a daily allowance — you can be "within budget" every day and still crash from the week's total
Part 2 — Five common beliefs the evidence challenges
1. "I can feel when I'm overdoing it"
This is the most dangerous myth — not because you're wrong about your body, but because your body actively hides the overdraft from you. During activity, your stress hormones (adrenaline, cortisol) create a false sense of capacity. You feel normal. Maybe even good.
The Mowinckels data shows that on the day before a crash, activity spiked roughly 30% above personal baseline — and subjective energy felt fine. When activity exceeded 20% above baseline, crash probability jumped from under 5% to over 65%. Although this is data from only one individual and may not be generalizable, it is still worth noting and checking.
Your body's alarm system fires after the damage, not during. This is not a character flaw — it's documented physiology. The HPA axis in ME/CFS shows blunted cortisol rhythms and altered stress responses that likely contribute to this masking effect (Tomas et al. 2013)
2. "Resting heart rate + 15 beats per minute is my safe limit"
The Workwell Foundation's "RHR + 15 bpm" heuristic is widely used in the ELC community as a proxy for the anaerobic threshold. Many apps and pacing protocols are built around it.
It has zero published validation. No peer-reviewed study has validated this formula against objective physiological thresholds in ME/CFS or any other population. This doesn't mean it's wrong — it means nobody has rigorously checked. It can over-restrict people with naturally low resting heart rates and dangerously under-protect those with elevated resting HR from POTS or medications.
Moreover, the 2-day CPET test (a repeat cardiopulmonary exercise test on two consecutive days, used to objectively measure whether exertion lowers the body's energy capacity the following day) - once considered the gold standard for objectively proving PEM — has recently shown some variation in findings across studies, meaning the picture may be more complex than initially thought. Mancini et al. (2026, Frontiers in Physiology) found essentially no day-2 decline in oxygen consumption (VO₂peak Day 1: 22.3, Day 2: 22.5 ml/kg/min). What did differ: perceived exertion was significantly higher at all workloads.
A personalized threshold derived from your own data will always be more reliable than a population formula. If you use RHR+15 as rough guidance, it can be a starting point — but don't treat it as a hard scientific boundary.
3. "My HRV was low, so I knew a crash was coming"
Heart rate variability (HRV) is real physiology with real meaning. But the specific claim — that low nocturnal or morning HRV predicts a next-day crash in ME/CFS — has no published prospective evidence with effect sizes. Zero studies.
What we do see, including in our own community data: HRV on crash days tends to go up, not down. This likely reflects parasympathetic rebound — when you're inactive (because you're crashing), your vagal tone increases. Vagal tone reflects how active the 'rest-and-recover' branch of your nervous system is — it goes up when you're at rest, which shows up as higher HRV and lower heart rate, even though you actually feel terrible during a crash. The wearable is reading your rest, not predicting your crash.
The Visible app study (Aitken et al., 2026), which had 4,244 users with 530K check-ins, found that morning HR + HRV combined with symptom reports predict same-day worsening. But same-day is not next-day. The prediction comes too late to prevent the crash.
Consistent with principles described in Shaffer & Ginsberg, the real signal may not be low HRV or high HRV, but HRV instability — wild day-to-day swings in either direction (Shaffer & Ginsberg, 2017).
4. "The 2-day exercise test proves I have PEM"
The 2-day cardiopulmonary exercise test (CPET) has been a cornerstone of ME/CFS advocacy. Earlier studies (VanNess, Snell & Stevens, 2007) reported significant day-2 declines. The Mancini et al. (2026) study could not replicate this. No significant day-2 decline. Calculated effect size d ≈ 0.04 — essentially zero. However, peak heart rate was lower (chronotropic incompetence) and perceived exertion was higher at all workloads — confirming that something IS wrong, just not what the original test measured.
5. "More steps = more crashes"
Technically true but practically useless. The majority of abandoned crash prediction projects failed because their models were simply detecting activity levels, not PEM-specific physiology. The question that matters is not "did she walk a lot?" but rather: "on days when she walked a similar amount, why did she crash on some and not others?" That's the PEM question. Activity level alone doesn't answer it.
Part 3 — Three things the evidence does support
Your period probably shifts your crash threshold
Resting heart rate rises from the follicular to the luteal phase of the menstrual cycle — confirmed by wearable data across multiple studies (i.e. Jasinski et al., 2024). HRV drops. Cortisol reactivity increases. For someone operating near their energy ceiling, that 3 bpm shift could eat the entire "safe buffer."
No study has directly measured PEM threshold shifts across cycle phases in ME/CFS — this is an active research gap. But the evidence is strong enough - HRV reliably drops and resting heart rate rises in the late luteal and early menstrual phase, signaling reduced autonomic capacity — that planning lower-demand weeks around those days is physiologically reasonable.
Pacing works — and the proof is paradoxical
Here's an unexpected finding: when pacing works, the correlation between activity and crashes disappears. People who successfully stay within their energy envelope don't show the load-crash pattern in their data, because they're preventing crashes before they happen.
This "pacing paradox" means that if your wearable data shows no clear activity-crash pattern, it might not mean crashes are random — it might mean you're pacing well.
Your crashes are not random — they're personal
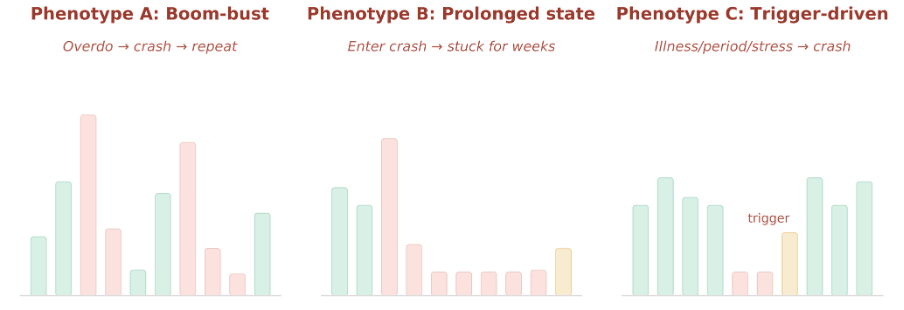
Our own community data reveals at least three distinct crash patterns. About 17% show classic boom-bust cycling (overdo, crash, repeat) (Phenotype A), roughly 50% of crash tags come from prolonged crash states lasting one to two weeks (Phenotype B), and the remainder are triggered by illness, hormonal shifts, or emotional stress — independent of activity level (Phenotype C).
This heterogeneity explains why no single pacing strategy works for everyone. Your crash pattern is yours. Understanding which type you tend toward is the first step to managing it.
Part 4 — What we're building and how you can help
Our community dataset is important
There is no publicly available dataset anywhere in the world that combines wearable data (heart rate, steps, sleep, HRV) with patient-labeled PEM crash events. Not one. Our community is creating the first such resource.
What a crash early warning could look like
Based on the evidence, a practical system would combine your personal baselines across multiple signals:
Yesterday's activity vs YOUR baseline
HRV stability past 7 days
Last night's sleep
Cycle phase
7-day cumulative load
Risk estimate
Green
Normal capacity
Yellow
Reduce demands
Red
Rest day
Research suggests that 21 days of personal data is enough to calibrate such a system to your individual patterns. It wouldn't be a diagnosis or medical advice - it would be a nudge. A second opinion from your wearable, for the days when your body is sending you mixed or unclear signals.
References
- 1.Appelman, Brent, et al. "Muscle abnormalities worsen after post-exertional malaise in long COVID." *Nature communications* 15.1 (2024): 17.
- 2.Aitken, A., et al. (2026). Digital physiological biomarkers predict within-person symptom changes in complex chronic illness. *npj Digital Medicine*. https://doi.org/10.1038/s41746-026-02543-3 https://doi.org/10.1038/s41746-026-02543-3
- 3.Jason, L. A., Brown, M., Brown, A., Evans, M., Flores, S., Grant-Holler, E., & Sunnquist, M. (2013). Energy conservation/envelope theory interventions to help patients with myalgic encephalomyelitis/chronic fatigue syndrome. *Fatigue: Biomedicine, Health & Behavior*, *1*(1–2), 27–42. https://doi.org/10.1080/21641846.2012.733602 https://doi.org/10.1080/21641846.2012.733602
- 4.Jasinski, S. R., Presby, D. M., Grosicki, G. J., Capodilupo, E. R., & Lee, V. H. (2024). A novel method for quantifying fluctuations in wearable derived daily cardiovascular parameters across the menstrual cycle. *npj Digital Medicine*, *7*(1). https://doi.org/10.1038/s41746-024-01394-0 https://doi.org/10.1038/s41746-024-01394-0
- 5.Hartle, Megan, Lucinda Bateman, and Suzanne D. Vernon. "Dissecting the nature of post-exertional malaise." *Fatigue: Biomedicine, Health & Behavior* 9.1 (2021): 33-44.
- 6.Mancini, D. M., Cook, D. B., Brunjes, D. L., Soto, T., Blate, M., Quan, P., Yamazaki, T., Norweg, A., & Natelson, B. H. (2026). Cardiopulmonary exercise test results do not change over two sequential days in patients with chronic fatigue syndrome. *Frontiers in Physiology*, *17*, Article 1816082. https://doi.org/10.3389/fphys.2026.1816082 https://doi.org/10.3389/fphys.2026.1816082
- 7.Montoya, Jose G., et al. "Cytokine signature associated with disease severity in chronic fatigue syndrome patients." *Proceedings of the National Academy of Sciences* 114.34 (2017): E7150-E7158.
- 8.Mowinckel, A. M. (2026). *Two years of Visible: New angles on the Long Covid data* [Independent longitudinal self-tracking analysis, not peer-reviewed]. drmowinckels.io. https://drmowinckels.io/blog/2026/visible-year-two/ https://drmowinckels.io/blog/2026/visible-year-two/
- 9.Naviaux, R. K., Naviaux, J. C., Li, K., Bright, A. T., Alaynick, W. A., Wang, L., Baxter, A., Nathan, N., Anderson, W., & Gordon, E. (2016). Metabolic features of chronic fatigue syndrome. *Proceedings of the National Academy of Sciences*, *113*(37), E5472–E5480. https://doi.org/10.1073/pnas.1607571113 https://doi.org/10.1073/pnas.1607571113
- 10.Sanal-Hayes, Nilihan EM, et al. "A scoping review of ‘Pacing’ for management of Myalgic Encephalomyelitis/Chronic Fatigue Syndrome (ME/CFS): lessons learned for the long COVID pandemic." *Journal of translational medicine* 21.1 (2023): 720.
- 11.Shaffer, F., & Ginsberg, J. P. (2017). An overview of heart rate variability metrics and norms. *Frontiers in Public Health*, *5*, Article 258. https://doi.org/10.3389/fpubh.2017.00258 https://doi.org/10.3389/fpubh.2017.00258
- 12.Tomas, C., Newton, J., & Watson, S. (2013). A review of hypothalamic-pituitary-adrenal axis function in chronic fatigue syndrome. *ISRN Neuroscience*, *2013*, Article 784520. https://doi.org/10.1155/2013/784520 https://doi.org/10.1155/2013/784520
- 13.VanNess, J. M., Snell, C. R., & Stevens, S. R. (2007). Diminished cardiopulmonary capacity during post-exertional malaise. *Journal of Chronic Fatigue Syndrome*, *14*(2), 77–85. https://doi.org/10.1300/J092v14n02_07 https://doi.org/10.1300/J092v14n02_07
- 14.White, A. T., & Light, A. R. (2012). Differences in metabolite-detecting, adrenergic, and immune gene expression after moderate exercise in patients with chronic fatigue syndrome, patients with multiple sclerosis, and healthy controls. *Psychosomatic Medicine*, *74*(1), 46–54. https://doi.org/10.1097/PSY.0b013e31824152ed https://doi.org/10.1097/PSY.0b013e31824152ed
Note: Several claims in this document (RHR+15 lack of validation, absence of nocturnal HRV prediction studies, menstrual phase PEM threshold shifts) are supported by the documented absence of peer-reviewed evidence — which is itself a finding. Where no formal study exists, we say so explicitly.