When the drain is invisible
Sensory and cognitive load, brain injury, and what a wearable can and cannot see
Prepared 2026 · Energy Lab R&D · descriptive, per-user normalized · data through 2026-07-10
A short, layered look through Welltory's own load-and-battery signals, our community data, a healthy reference, and the research.
Community question — group case
A question that comes up across the Energy Lab community: whether the shape of a crash looks different for people whose energy-limiting illness follows a head injury or a toxic environmental exposure — and whether an app that mostly counts movement can even see the drain that comes from light, motion, driving, screens and concentration rather than from steps.
THE SHORT VERSION
If you only have energy for one page
Three lines and one chart. Read whatever parts you have energy for; the sections after just show the working.
- We move less, while the body works harder. Compared with a healthy reference, our community takes about half the daily steps, yet the body rests at a heart rate about 9 bpm higher with less aerobic headroom. Moving less, but running hotter.
- Most of the effort that remains never shows up as movement. About 87% of our community's effortful minutes are logged while sitting still (mental and stress load), not moving. The drain from light, screens, driving and focus is real; a step count just files it elsewhere. A head injury or toxic exposure plausibly adds a further sensory and autonomic layer — the research points that way, though our own data has too few such members to prove it.
- No single number predicts a crash from a busy day. Across people, a busier day and the next day's readings barely move together — so impact is worth reading only against your own baseline, over the next one to three days.
Compared with a healthy reference: moving less, while the body works harder
Steps per day
we move about half as much
Resting heart rate (bpm)
our engine idles ~9 bpm hotter
Aerobic ceiling (max MET)
less headroom to spend
≈87%
of a day's effort is spent sitting still, under load
+9 bpm
resting HR vs a healthy reference
≈½
the daily steps of a healthy reference
24–72h
typical lag before a crash lands
STEP 1
Your energy buckets are real — and mostly invisible to a step count
Thinking in buckets — going out, driving, screens, focus, and whatever is left for home — closely matches how the body spends energy. Welltory already works this way: it tracks a daily battery and separates moving minutes from sitting-still minutes that still cost effort. Read that way, our community's moving bucket is tiny and the sitting-still-but-costly bucket is huge: about 377 minutes a day of loaded stillness against ~50 of movement, and nearly everyone spends most of their effortful time not moving.
Same person, same day — Welltory's own load minutes · ~87% of effortful time is spent still · 81 members
This is why three PT sessions a week can leave less for home than two outings: the biggest draws are things a pedometer never sees. Mental, sensory and physical effort pull from one shared pool, and the cost often lands a day to three later — which is what makes a crash feel like it came “for no reason” [8].
STEP 2
A smaller, hotter battery — and what an injury adds
The first-page comparison already shows the shared picture: our community moves about half as much as a healthy reference, yet the body idles hotter with less headroom. On top of that, a structural injury plausibly adds its own layer.
The resting-brain slowing many people are told about (excess slow-wave, delta and theta, activity) is a recognised correlate of post-concussion and neuroinflammatory states [1][3] — but it is consistent with several things at once and is not unique to any one, which is why a report lists possibilities rather than naming one [2]. That hotter idle has a known basis too: after brain injury, autonomic balance stays disturbed — a review of 89 studies finds heart-rate variability drops and can stay low even after symptoms resolve [4][5], leaving less spare capacity for an ordinary day. And air pollution and wildfire smoke are independently tied to brain inflammation, so an injury plus a smoke exposure can act as two hits on one system [6][7].
STEP 3
Potential vs realized: read it against yourself
Looking at a high-drain day before and after is a good instinct — with one honest limit. Across our community, the size of a busy day and the next day's readings barely move together: for some a busy day nudges the next morning's resting heart rate up, for others it settles. There is no shared dial to turn into a crash score.
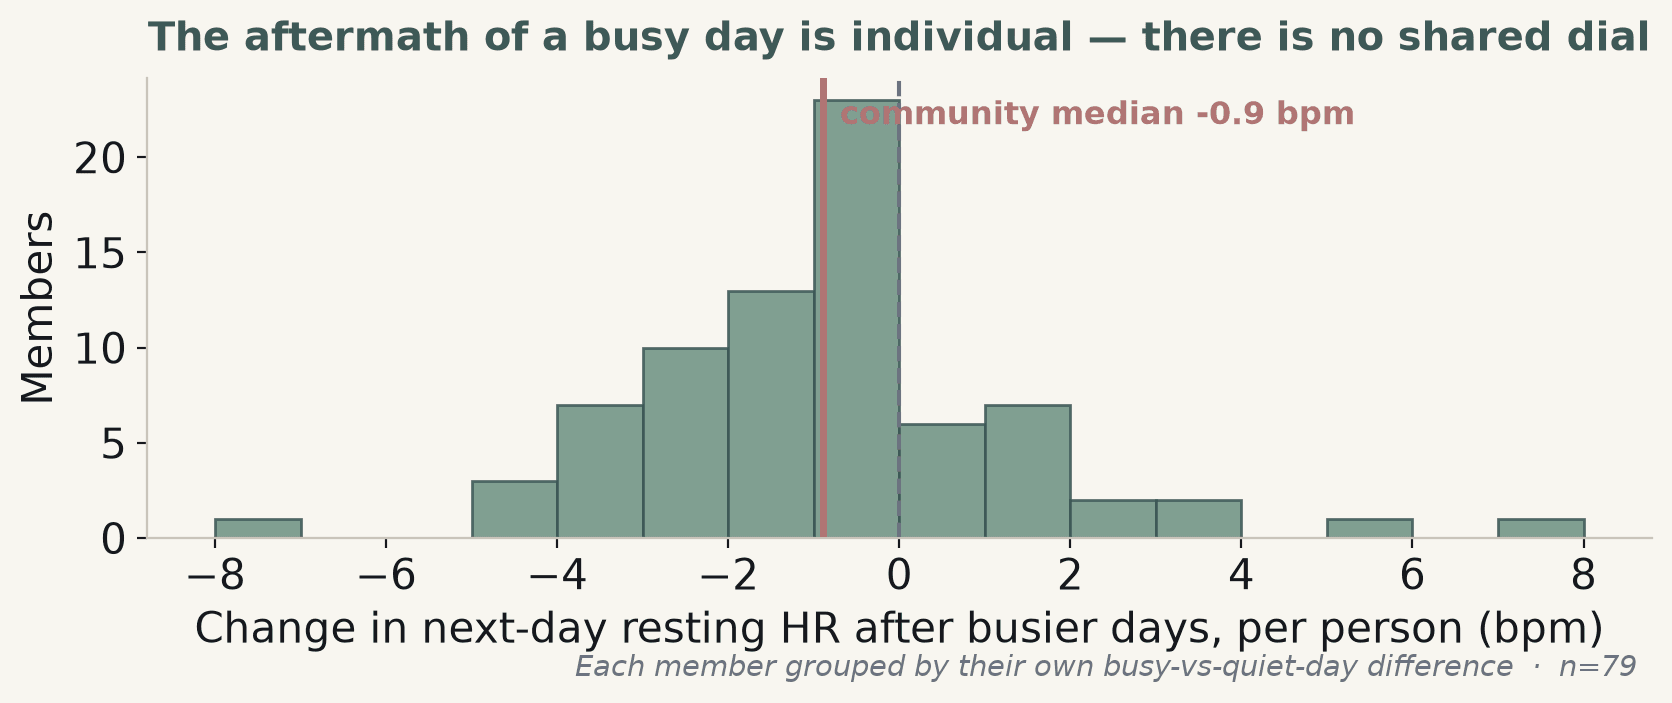
What works is a ledger read against yourself. Potential impact = what days like this have usually cost you (your own past battery drain and recovery time). Realized impact = what landed: the battery drawn down that day, plus the 24–72 hour tail in your resting heart rate and how you felt. Pairing a quick self-rating of capacity with the objective read turns a busy week into something you can plan against.
STEP 4
What could change if the app knew about the injury
A known injury doesn't need a group to be useful — it changes how one person's own numbers should be read. Four shifts follow, none of them adding pressure or scoring.
One — count loaded stillness as real effort, so a demanding but motionless day isn't read as rest. Two — let a sensory or cognitive event (an outing, a drive, a screen-heavy stretch, a PT block) be logged like movement already is. Three — expect and show a longer tail, reading load against the next one to three days. Four — let people mark an injury and their high-drain events — something this community has already asked for — so a baseline can shift with a person's history instead of anyone else's.
References
- 1.Buchanan D. et al. 2021 — Elevated and slowed EEG oscillations in post-concussive syndrome and chronic pain (Brain Sciences) https://pubmed.ncbi.nlm.nih.gov/33923286
- 2.Nuwer M. et al. 2005 — Routine and quantitative EEG in mild traumatic brain injury (Clinical Neurophysiology) https://pubmed.ncbi.nlm.nih.gov/16029958
- 3.Modarres M.H. et al. 2016 — EEG slow waves in traumatic brain injury: convergent findings in mouse and man (Neurobiology of Sleep and Circadian Rhythms) https://pubmed.ncbi.nlm.nih.gov/28018987
- 4.Talbert L.D. et al. 2024 — Traumatic brain injury and disruptions in heart rate variability: a systematic review (Applied Psychophysiology and Biofeedback) https://pubmed.ncbi.nlm.nih.gov/39222209
- 5.Esterov D. & Greenwald B.D. 2017 — Autonomic dysfunction after mild traumatic brain injury (Brain Sciences) https://pubmed.ncbi.nlm.nih.gov/28800081
- 6.Kim H. et al. 2020 — Air pollution and central nervous system disease: fine particulate matter and neurological disorders (Frontiers in Public Health) https://pubmed.ncbi.nlm.nih.gov/33392129
- 7.White A.R. 2024 — The firestorm within: extreme heat and wildfire smoke effects on brain health (Science of the Total Environment) https://pubmed.ncbi.nlm.nih.gov/38417511
- 8.Chu L. et al. 2018 — Deconstructing post-exertional malaise in ME/CFS: a patient-centered survey (PLoS ONE) https://pubmed.ncbi.nlm.nih.gov/29856774
EVIDENCE & LIMITS
How to weigh this
A descriptive, community-level look meant to make sense of a pattern — not a diagnosis.
Welltory day-level and journal data from the Energy Lab community, per-user normalized, through 10 July 2026 (81 members with movement/battery signals; coverage generated 2026-07-12). Heart-rate variability is only read within a person over time, never between people. The healthy reference is a set of relatively healthy, active people compared only on identically-defined fields (steps, resting HR, aerobic ceiling); the groups differ in age, devices and era as well as illness, so it is a disease-plus-population contrast, not a clean split. The movement-vs-loaded-stillness split is within our own community (same person, same day). Load and symptoms are read with a 24–72 hour lag.
Welltory Energy Lab · general information from community data, not a substitute for medical advice.