Community explainer
What a Healthy Nervous System Looks Like Across a Day
Reading stress and recovery when there's no single "normal."
Original PDFReading a day of stress and recovery gets much easier with something to read it against. What follows is that missing reference point — what an unremarkable day tends to look like on a nervous system without a chronic condition, and how to use it as a frame rather than a finish line.
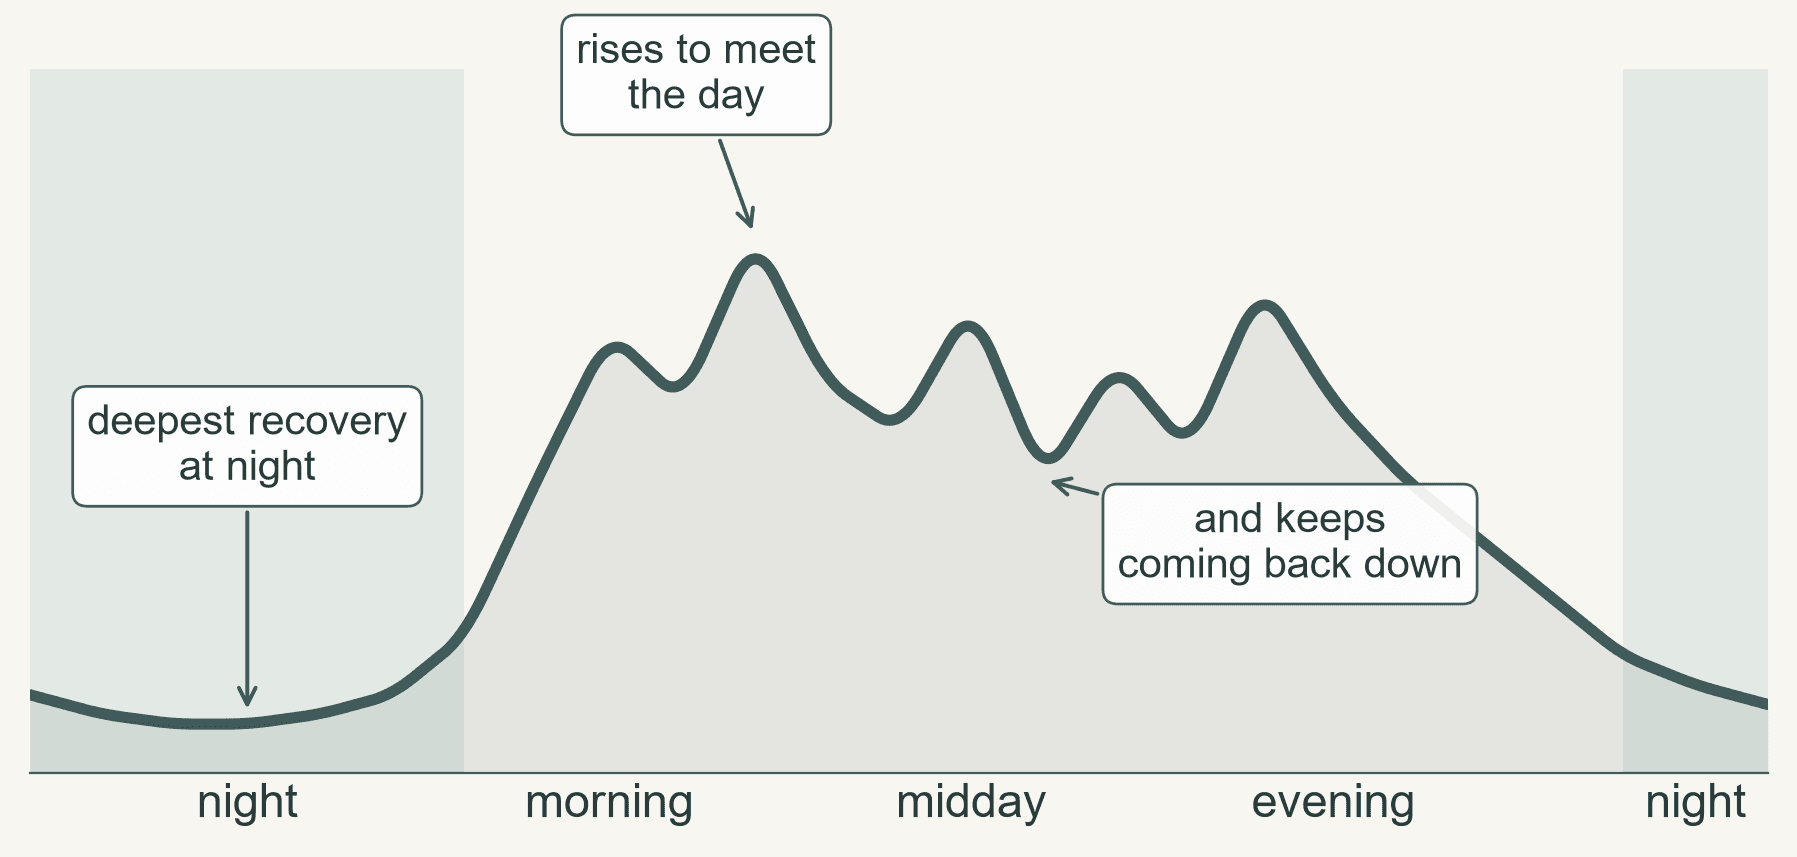
If today is a one-page day
Healthy nervous systems don't agree on much. They run hot or cool, jumpy or steady, and two perfectly well people can post very different days. What they share isn't a number — it's a motion: they rise to meet whatever the day brings, and then they settle back down, dropping deepest at night. That rise-and-return is the thing worth looking for.
Three questions come up again and again, so the piece takes them in turn:
- what a healthy day actually looks like,
- how a healthy body takes a hit of stress and finds its way back,
- and how much of the day is "supposed" to sit in each state.
That last one has a more useful answer than a number, and it lives in Part 3.
One thing to hold from the start: all of this is descriptive — population physiology and two real reference days, not a benchmark and not a diagnosis. The comparison that ever really means anything is to your own earlier weeks, never to someone else's readings. Heart-rate variability especially is personal; only its trend inside one body says anything at all.
Part 1
What a healthy day tends to look like
Across a day, Welltory's Stress Report sorts the signal into a handful of states, shown as coloured bands on the Daily Timeline. Each one is read from heart rate against your own resting baseline — so it reflects what the body is doing, which is not always the same as what you feel:
- Sleep — overnight rest, the body's deepest recovery window.
- Recovery — a calm, restoring state, with the "rest-and-digest" (parasympathetic) side in the lead: heart rate at or near its resting baseline.
- Neutral — a settled middle: neither pushing nor deeply restoring.
- Activity — moving or exercising, with heart rate up to meet real physical effort. Welltory files this apart from stress on purpose: a raised heart rate you are moving for is the system working as designed, and movement actually helps bring the day's stress load down.
- Stress — the one worth understanding: heart rate well above baseline while the body is still. It reads as stress precisely because there is no movement behind it — the body is "working hard, staying alert" while sitting, worrying, or pushing through a hard task. This is what the question above calls sedentary stress. The other term it uses, active stress, is really just Activity here — a raised heart rate with movement, which the app treats as healthy rather than as stress at all.
The clearest way to see a healthy day is to look at one. Two colleagues at Welltory — neither of whom lives with PEM, an ELC-type condition, or a chronic illness — shared their own Stress Reports for this; we'll call them Sofia and Rita (names changed). Their days look almost nothing alike, and both are healthy.
Sofia — a naturally calm day
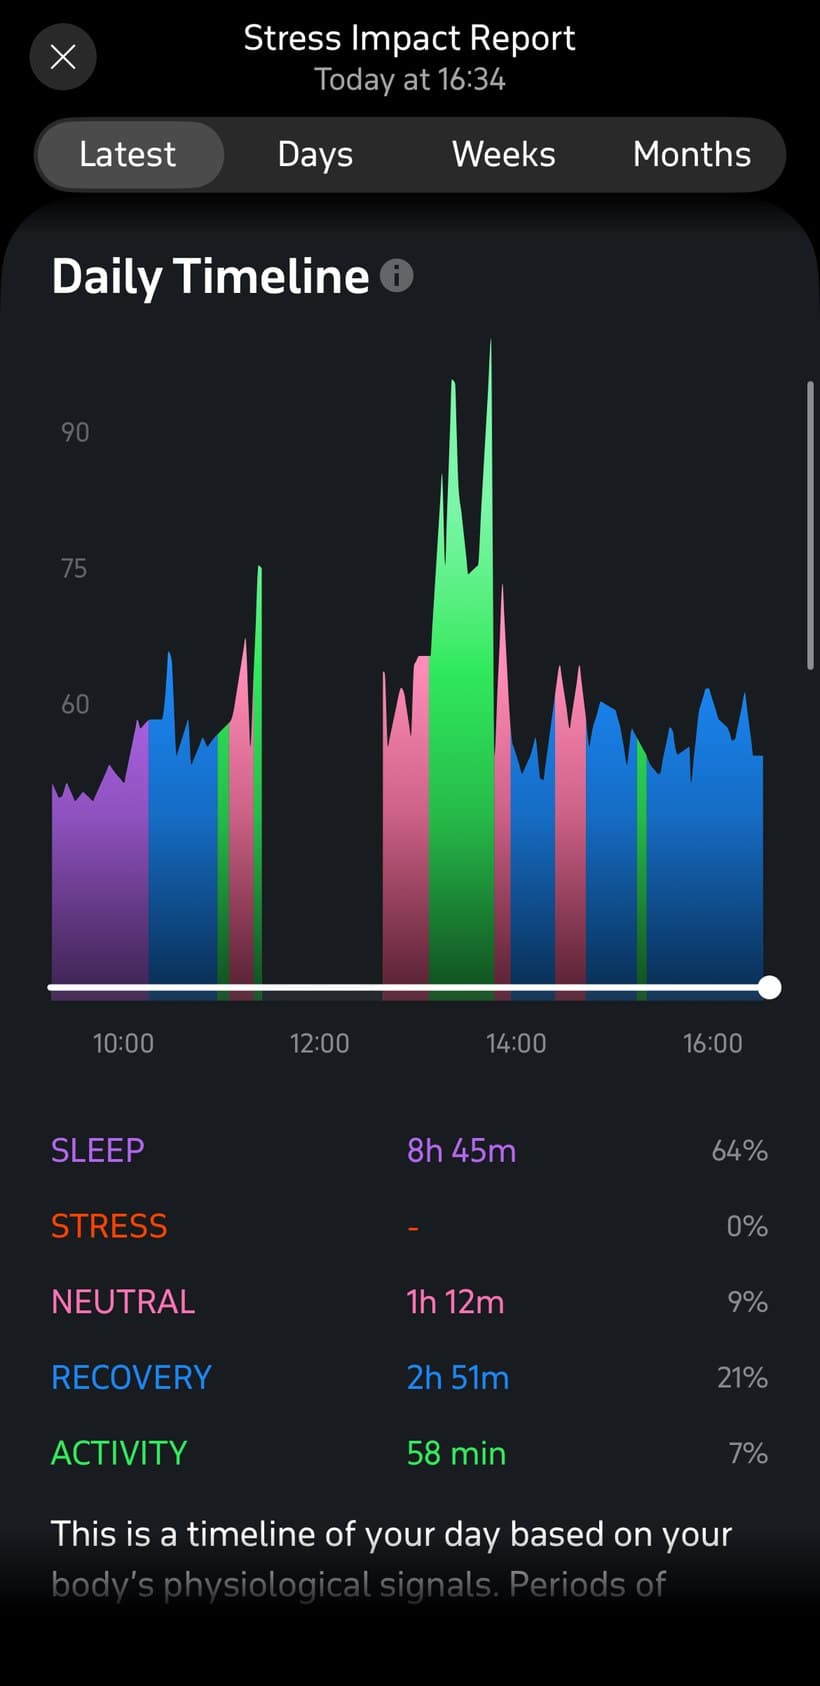
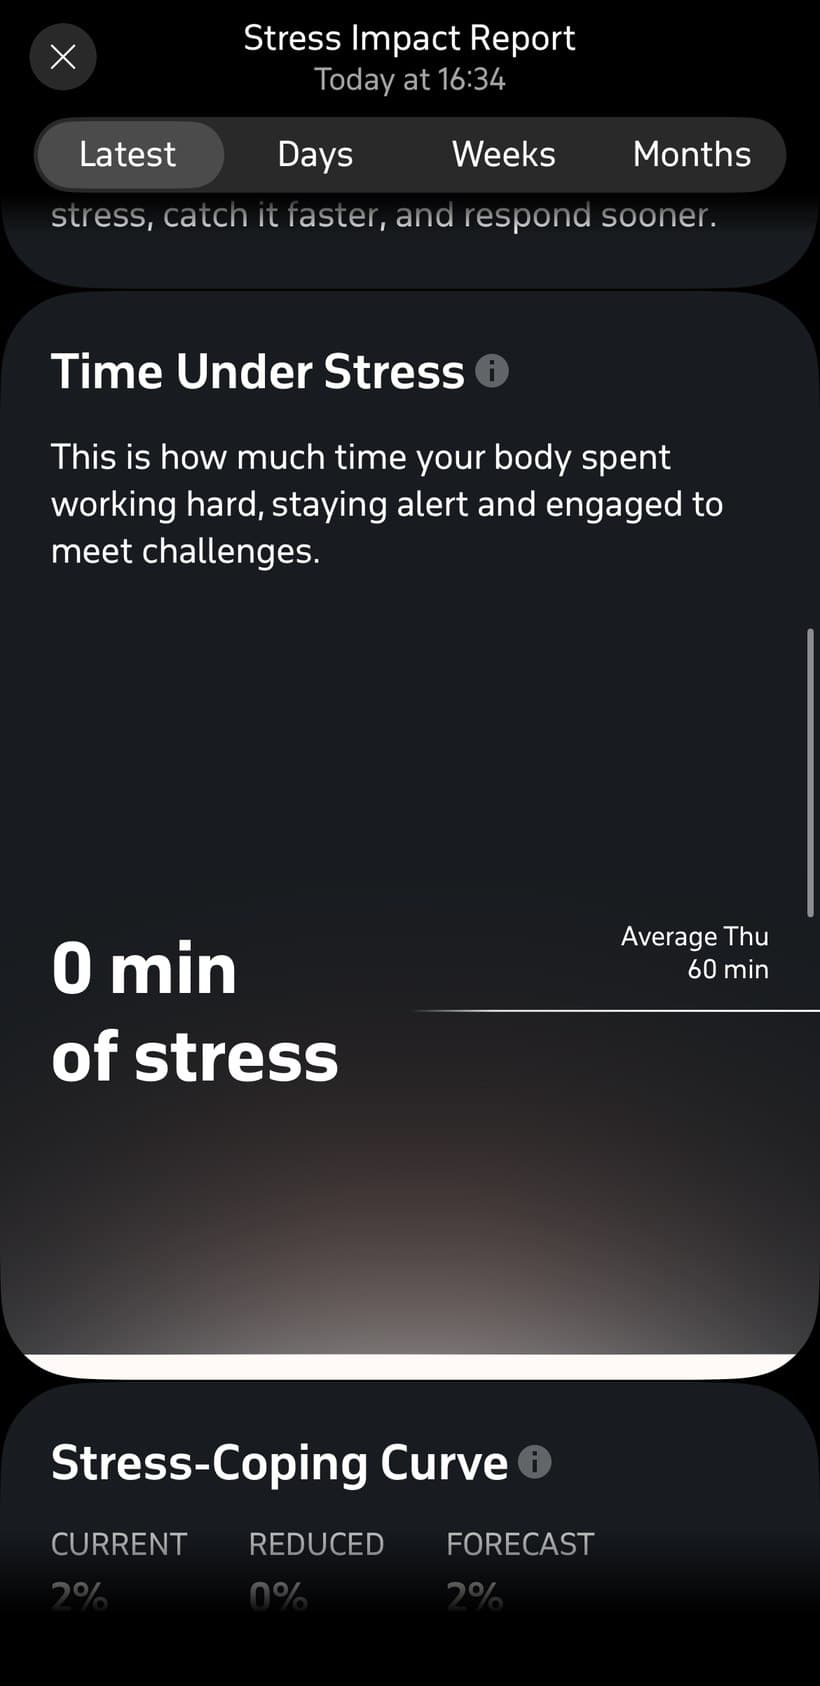
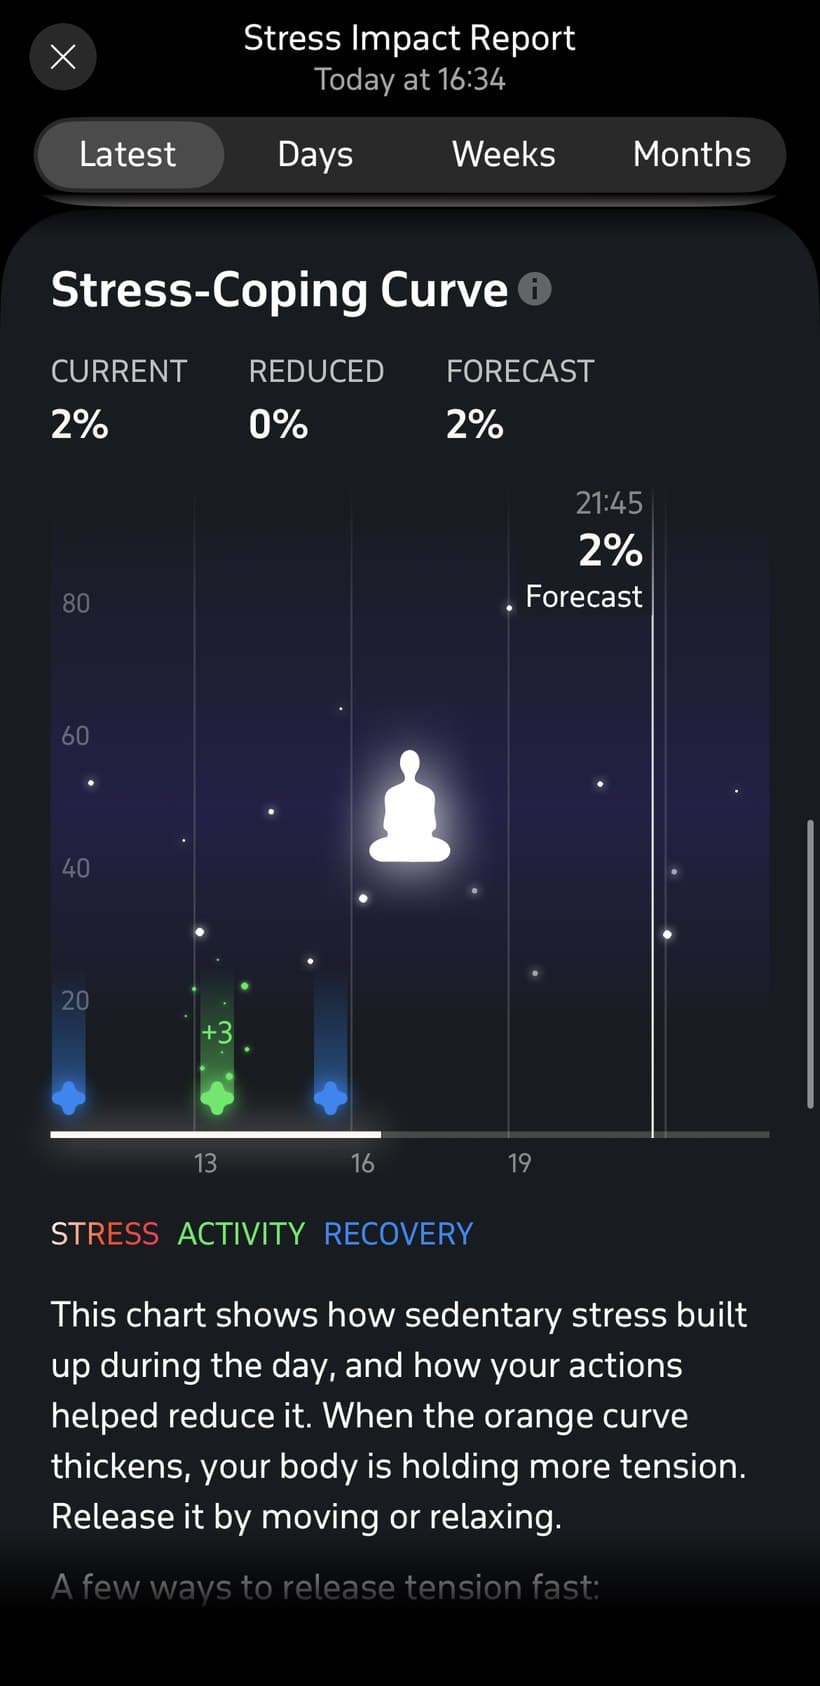
Sleep 64% · Recovery 21% · Neutral 9% · Activity 7% · Stress 0%
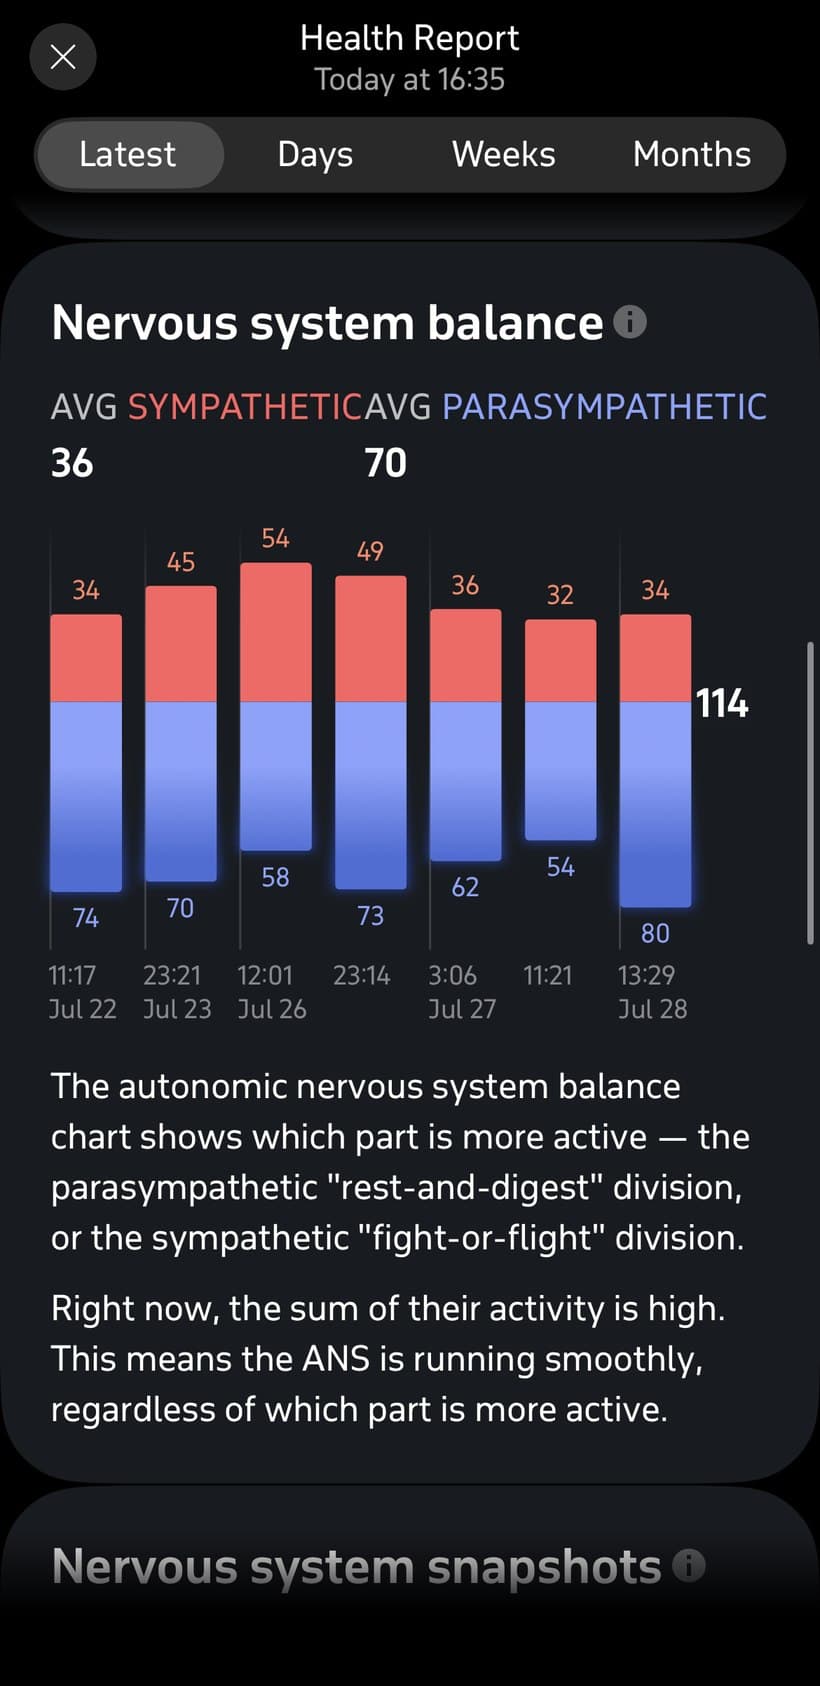
Sofia, in her 30s, has a naturally even, low-stress temperament, and barely registers any stress on this day. Her timeline is mostly sleep and recovery, with a little light activity and a stress band that is essentially empty. Her nervous-system balance leans parasympathetic — "rest-and-digest" well ahead — and the app reads the overall system as running smoothly. This is what a low-key, recovery-rich day can look like.
Rita — a busy, active day
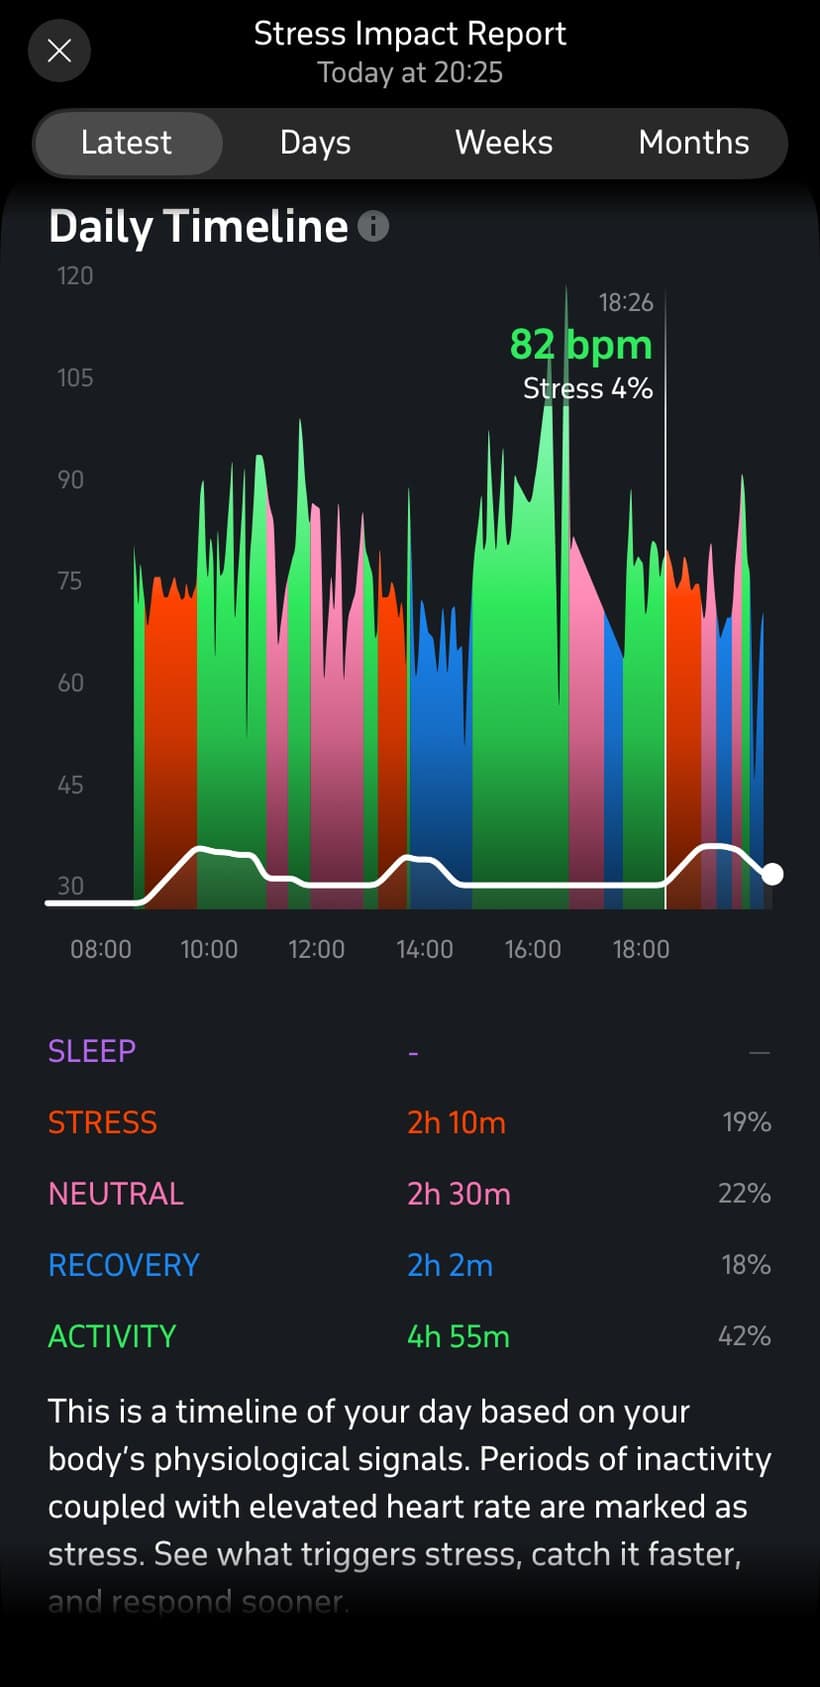
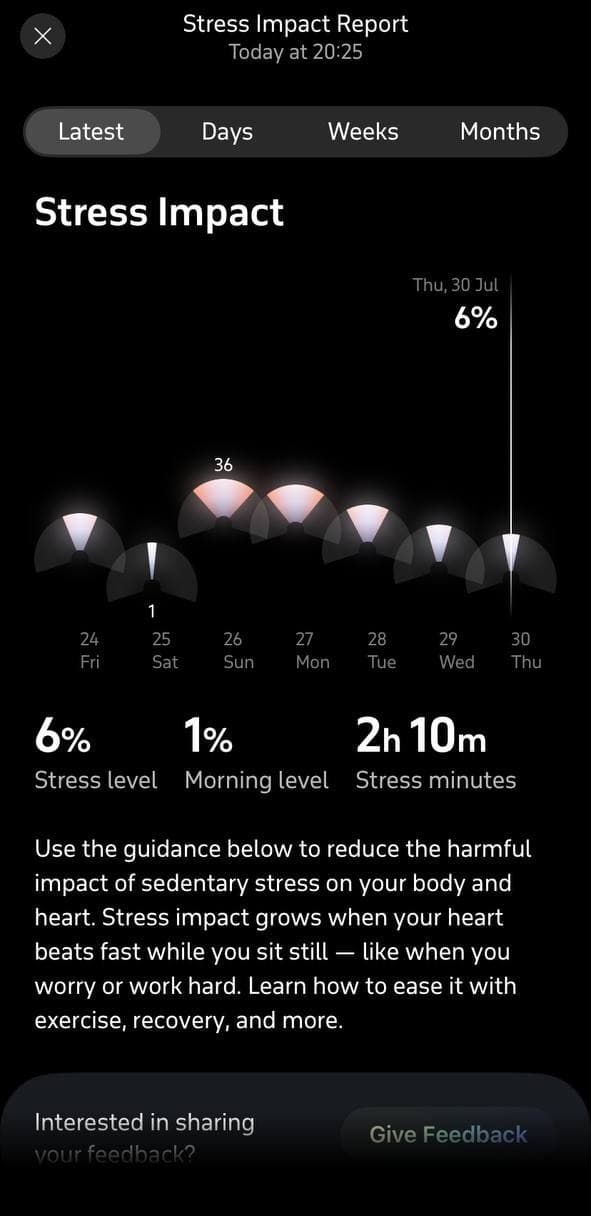
Activity 42% · Neutral 22% · Stress 19% · Recovery 18%
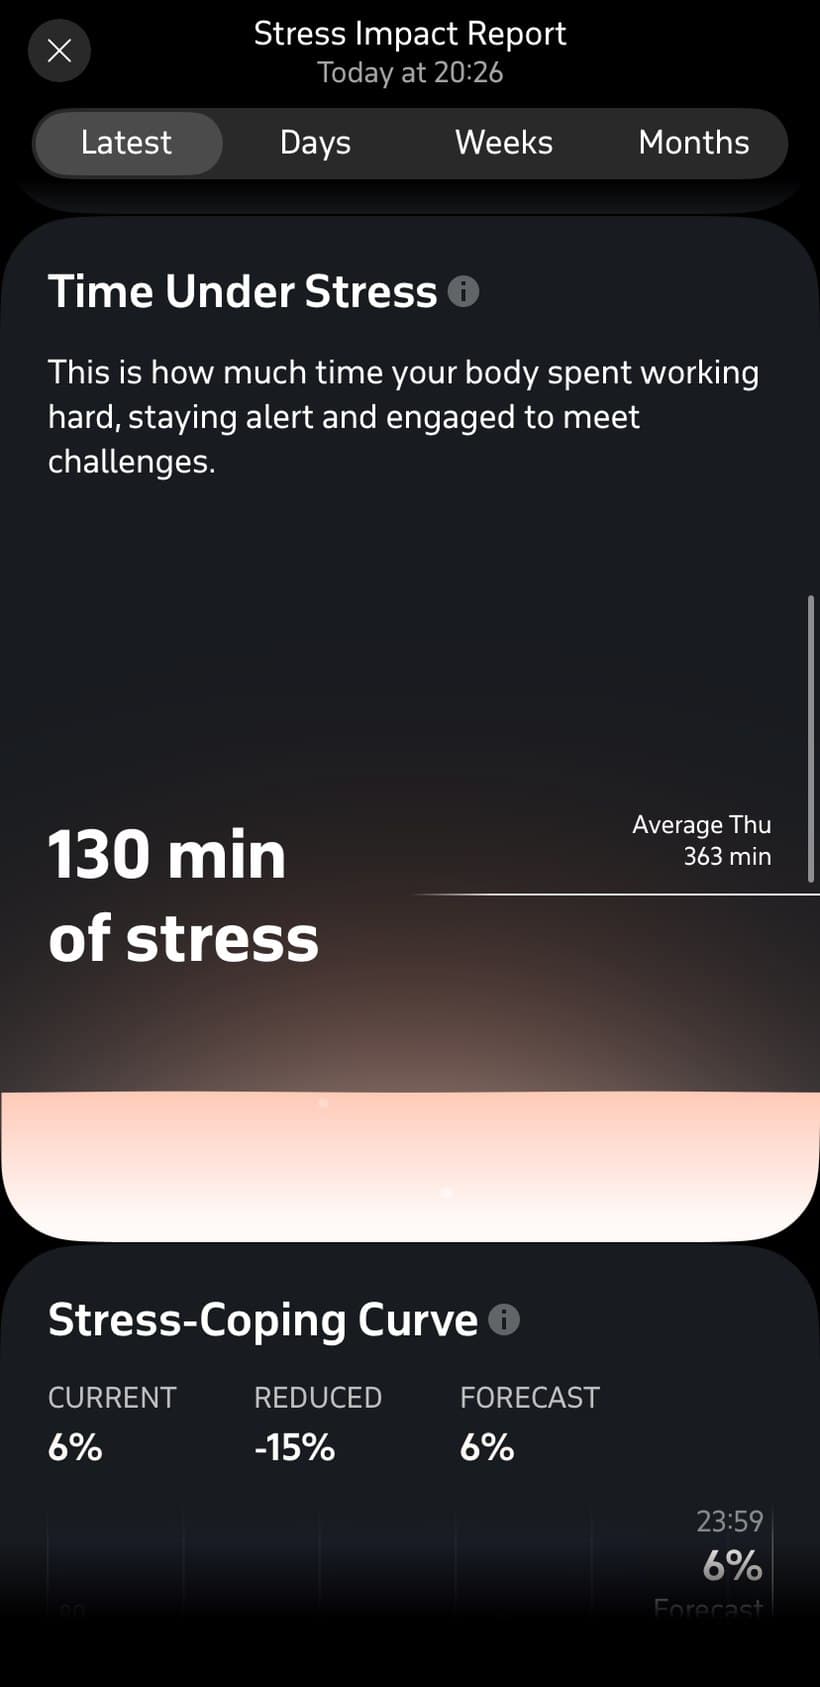
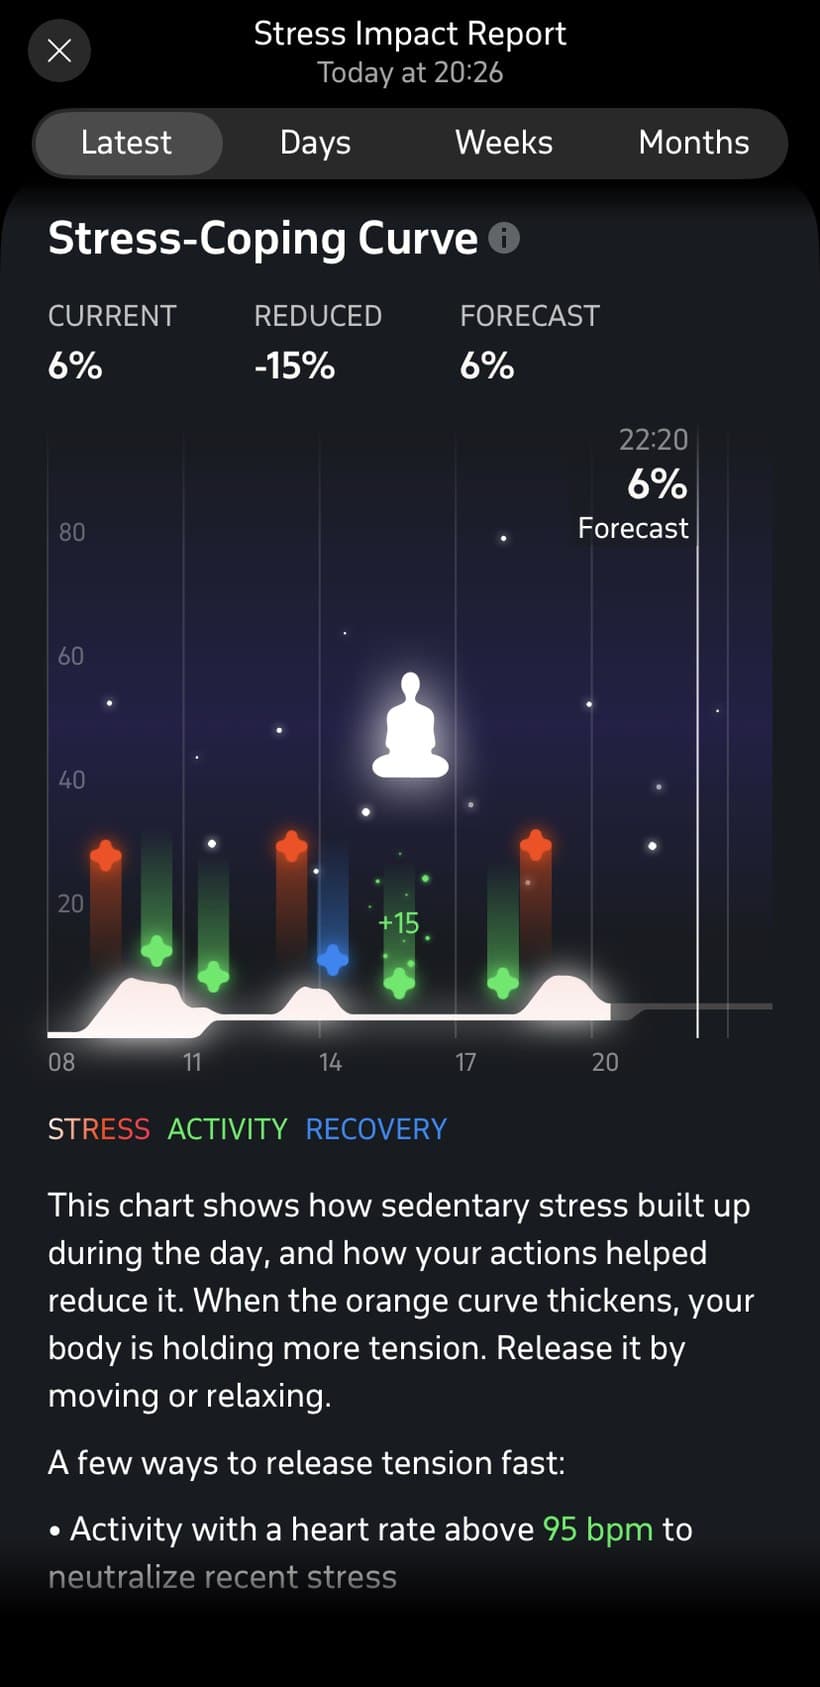
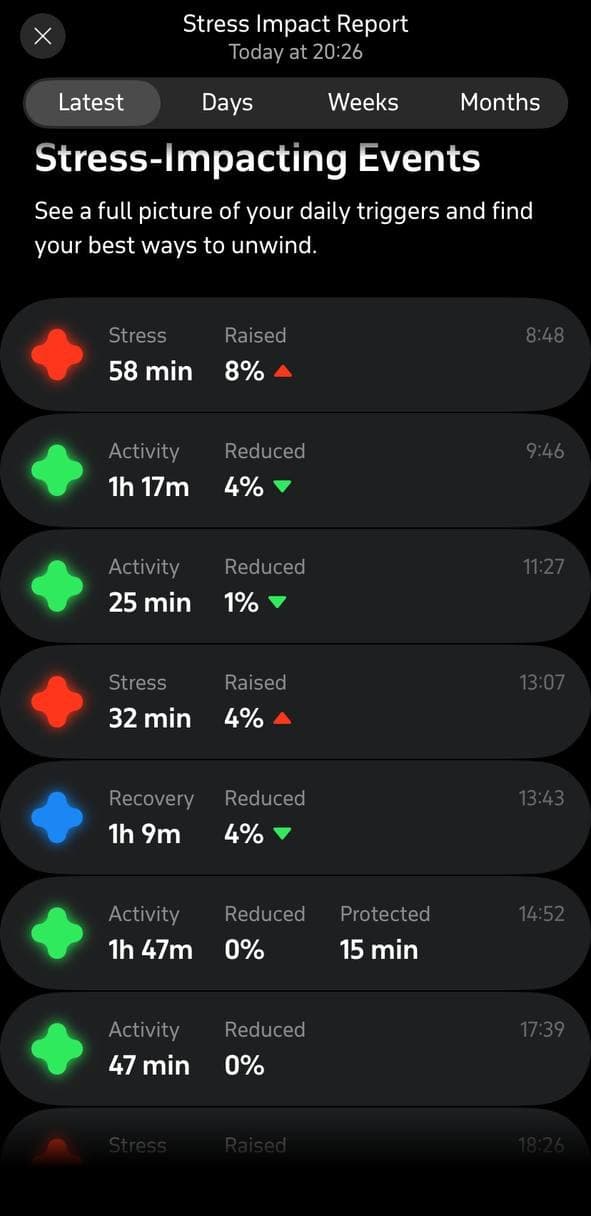
Rita, in her 40s, is rebuilding after a long stretch of burnout and has recently come back to regular exercise, alongside a mentally demanding job. Her day is full in the opposite way: nearly half of it is Activity, with real stretches of stress, neutral, and recovery threaded through. Stress does show up — a block in the morning — but movement through the day keeps bringing it back down, and the day lands well below her own recent average. A very different nervous system, doing its job just as well.
Set side by side, a few things stand out:
- There is no single shape. A calm day and a busy, active day can both be healthy and look almost nothing alike.
- All the states turn up. On a full day, sleep, recovery, neutral, activity, and stress all make an appearance. A healthy day is a mosaic, not a flat line of calm.
- Stress has edges, and movement gives it somewhere to go. On the busy day you can watch stress get raised and then reduced as activity and recovery take over. The rises resolve; they don't just stack up.
- Recovery is present and reachable — whether as a big overnight block or as pockets threaded through a busy day.
That last point is the anchor for everything that follows.
Part 2
How a healthy system handles stress, and finds its way back
A moving signal is the healthy one. It is tempting to read "no stress all day" as the healthy picture, but a nervous system that never changes gear is not the calm one — a rigid, unchanging heartbeat usually means the system has stopped adapting. Health looks like variability: the body shifting fluidly between arousal and rest as the day changes. Welltory's own nervous-system-balance view leans on the same idea — when the combined sympathetic and parasympathetic activity is high, the system is regulating well, whichever side happens to be ahead.
Stress during effort is the system working. Climbing stairs, focusing hard, exercising — the sympathetic ("mobilise") side is supposed to rise. That is why the app files movement under Activity rather than Stress, and even counts a stretch after hard exercise as protected: a raised heart rate you are moving for is a healthy response scaled to a real demand, not something to fix.
The signal is the return. In a healthy system, once the stressor passes, the rest-and-digest side re-asserts itself and the body drifts back toward baseline within minutes to a couple of hours. The busy reference day has exactly that shape: a block of stress in the morning, then activity and recovery through the day steadily working it back down, until it ends well below her own recent average. The height of a stress peak matters far less than whether, and how smoothly, the system comes back down.
Night is where the deep recovery happens. The single largest recovery window in a healthy day is sleep — visible as the big sleep-and-recovery share on the calm day above. Deep sleep lets the parasympathetic side dominate and restores the next day's capacity; overnight is when heart rate settles to its lowest and variability rises to its highest. In large wearable datasets, the things that blunt this overnight recovery — a hard, late effort, for instance — show up as a higher night-time heart rate and lower night-time variability. When the night goes deep, the system has somewhere to reset.
Part 3
The part everyone wants as a number, and what to read instead
The most concrete version of the question is the natural one: roughly what share of the day a healthy person spends in Recovery, Neutral, Sedentary Stress, and Active Stress.
The honest answer is that there is no clean population benchmark for that split, and offering one would mislead. Those proportions move with the device and how it is worn, with how many hours are captured, with age and sex, with how active the day happened to be, and with the specific algorithm drawing the lines — and they vary enormously from one healthy person to the next.
Our two reference days show exactly that. One, captured from overnight into mid-afternoon, came out mostly sleep and recovery, with almost no stress at all. The other, captured across a waking day into the evening, came out nearly half activity, about a fifth stress, and the rest split between neutral and recovery. Two healthy people, two completely different splits — shaped as much by what each day held and how many hours were captured as by anything about their nervous systems. The report itself is built the same way: it weighs a day against your own recent weekday average, never against another person. Even our wider healthy reference group is measured like-for-like only on resting heart rate, daily steps, and peak effort — not on state proportions. There is no shared percentage hiding underneath, and nothing here to hit.
What the reference days do offer is a qualitative frame, held loosely: across a healthy day, all of the states appear, and recovery is reachable — it shows up, and it goes deep at night.
So two dials turn out to say more than "percent of the day," and both are read within one body over time, never against anyone else's:
- The return — after the day's stressors, whether arousal comes back toward the middle, and roughly how long that takes.
- The night — whether sleep still delivers a real block of recovery.
Tracked against your own earlier weeks, those two carry far more meaning than any single day's split of states.
Part 4
Reading bodies like ours against that shape
Held against that reference shape, bodies living with ME/CFS, Long COVID, POTS, and other forms of dysautonomia often read differently, and in fairly consistent ways: more sympathetic "mobilised" tone at rest, so more of the still hours register as sedentary stress; a slower, less complete return toward baseline after a stressor; and a flatter, shallower night — less of that deep overnight recovery block.
This is the physiology of these conditions — not a personal failing, and not a matter of resting the wrong way. The autonomic nervous system is directly affected in these illnesses; a body that sits in more sedentary stress and recovers more slowly is showing the condition, not a lack of effort or discipline.
The cost can arrive late. With post-exertional malaise, the price of a given day's exertion often lands 24 to 72 hours later. A calm-looking day and a hard day are not always where the consequences appear, so a single day's states read most fairly as information, not as a verdict on that day.
The comparison that helps is internal. Because all of this is personal and condition-shaped, the reference day is a frame for understanding the shape of your data — not a target the numbers are meant to converge on. What tends to be steadying for many of us is watching our own return and our own nights over weeks, at our own baseline.
The bottom line
Healthy, across a day, is not a low-stress flat line, and it is not a particular split of states. It is a system that can rise to meet the day and then come back down, and a night that still goes deep. "Normal" is a wide range rather than a line — and the most informative reference any of us has is our own earlier self. Seen that way, more sedentary stress and a thinner night in bodies like ours are not a mark against anyone; they are the condition speaking, in a language the data lets us read.
The two days, view by view
The same two days — Sofia's and Rita's — across the report's other views, with a note on what each is showing.
Sofia — the calm day
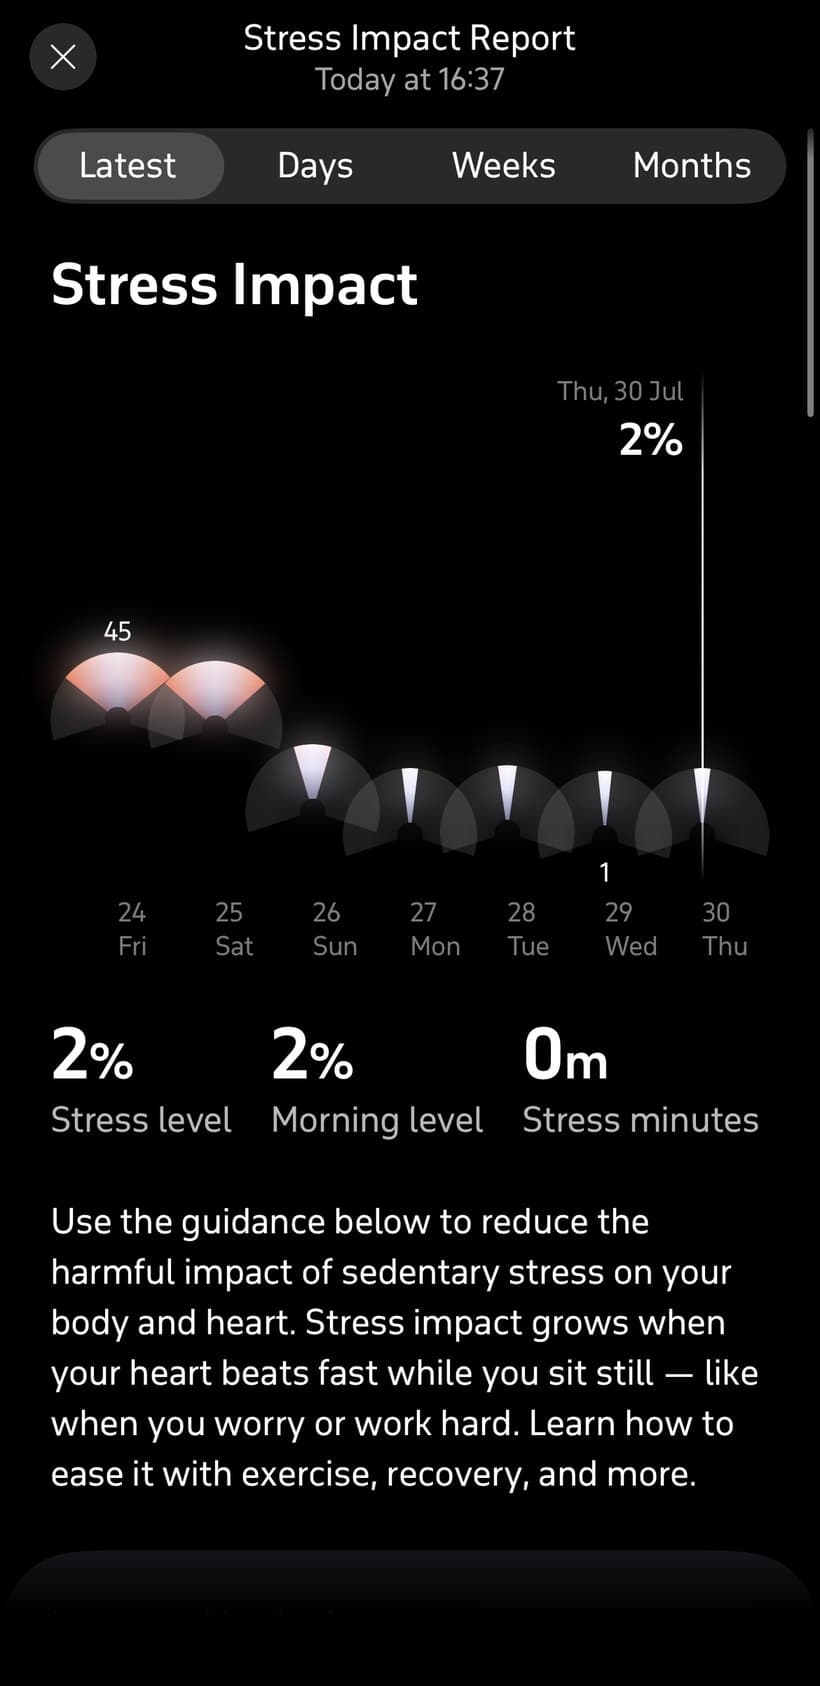
Rita — the busy, active day
Further reading
Most of these open to a free abstract or full text.
- 1.Shaffer F, Ginsberg JP (2017). An Overview of Heart Rate Variability Metrics and Norms. Frontiers in Public Health. https://doi.org/10.3389/fpubh.2017.00258
- 2.Thayer JF, et al. (2006). Beyond Heart Rate Variability: Vagal Regulation of Allostatic Systems. Annals of the New York Academy of Sciences. https://doi.org/10.1196/annals.1366.014
- 3.Thielmann B, et al. (2021). Heart rate variability as a strain indicator for psychological stress for emergency physicians during work and alert intervention: a systematic review. Journal of Occupational Medicine and Toxicology. https://doi.org/10.1186/s12995-021-00313-3
- 4.Leota J, et al. (2025). Dose-response relationship between evening exercise and sleep. Nature Communications. https://doi.org/10.1038/s41467-025-58271-x
- 5.Adler BL, Chung T, Rowe PC, Aucott J (2024). Dysautonomia following Lyme disease: a key component of post-treatment Lyme disease syndrome? Frontiers in Neurology. https://doi.org/10.3389/fneur.2024.1344862
- 6.Khan MS, et al. (2025). Cerebral Blood Flow in Orthostatic Intolerance. Journal of the American Heart Association. https://doi.org/10.1161/JAHA.124.036752
Evidence & limits
Welltory Energy Lab · general information from community data, not a substitute for medical advice.