Body vs Numbers mismatch
When your body and your numbers disagree
A field guide to the gap between how you feel and what your wearable says — clear, practical, grounded in evidence, and checked against our own community's data.
Original PDFYou are not imagining it, and you are not doing it wrong
Two situations, both familiar. You wake clear and capable for the first time in days, open the app, and it is red. Or you feel wrecked, and the app shows green, “recovered.” Either way the tension is the same: the body says one thing, the number says another. The rest of this guide is the evidence behind the short version above — and it ends somewhere hopeful.
1. What this looks like in our own community's data
For each member who logged how they felt and wore their watch, we compared their daily “how I feel” rating to their morning number — each person against their own baseline.
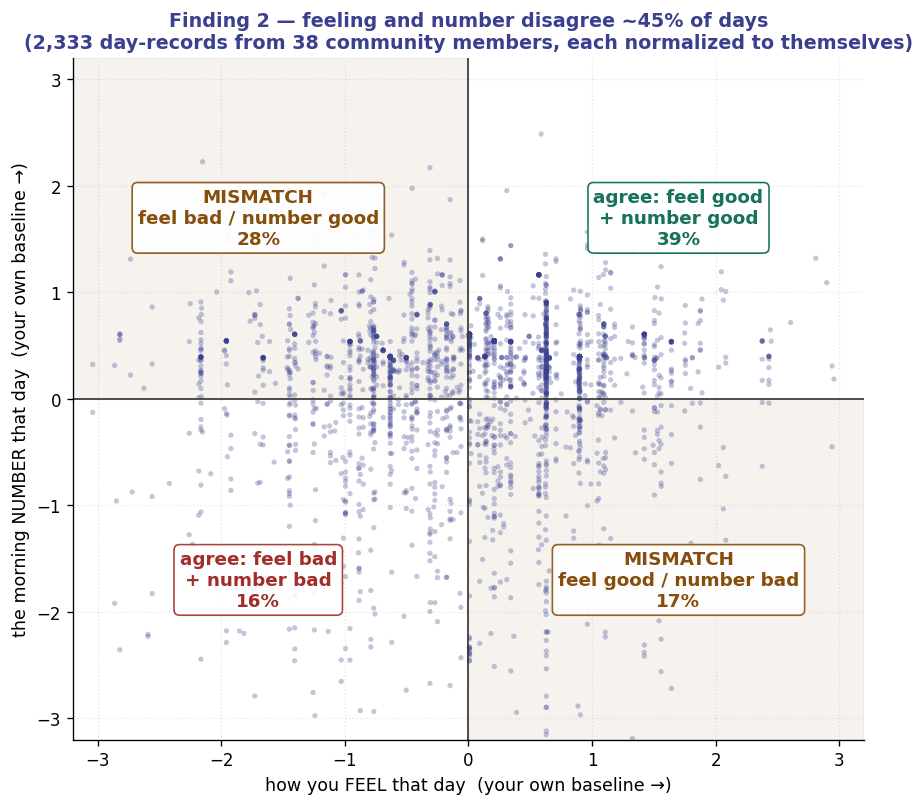
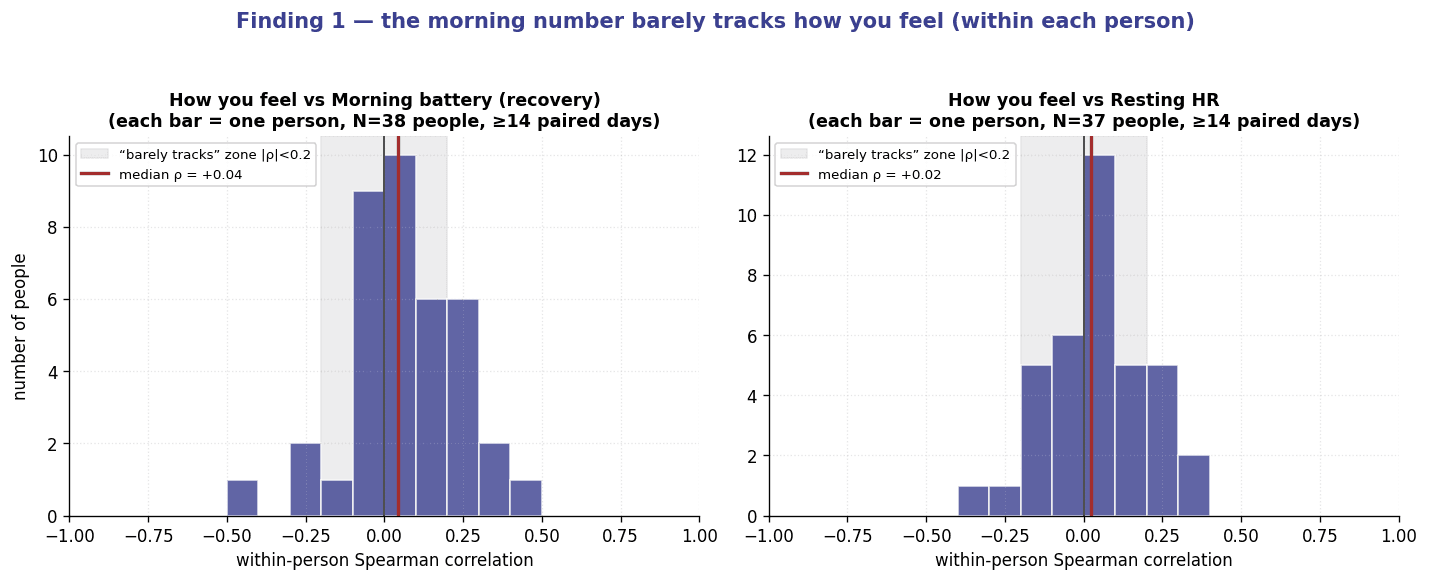
2. Why “I feel great” and “the data is red” are often the same signal
That surge of “I can do something” — especially a few days after a crash — is sometimes real recovery. But it can also be the body running on stress chemistry: adrenaline and cortisol, a revved-up nervous system. People describe it as “wired but tired”. A low HRV with a raised resting heart rate is the fingerprint of that same revved-up state. A 2024 meta-analysis (37 studies, 543 people with ME/CFS) found higher adrenaline at rest and an abnormal adrenergic response to exertion specifically in ME/CFS (Hendrix et al., 2024).
What happens in the body after over-exertion
During and just after
Adrenaline and cortisol surge - a false sense of capacity ("wired but tired")
Heart rate stays up, HRV stays suppressed longer than usual
4-24 hours
Immune system activates, inflammation rises
Nervous system stuck in stress mode
24-72 hours
Symptoms arrive - this is when the crash is felt
Energy systems still not recovered
Days after
Inflammation can stay elevated for days, not hours
3. Why “I feel terrible” and “the data is fine” is also real
The reverse gap is just as real — and in our data it is the more common of the two directions. An analysis of ~2.5 million records concluded, almost word for word: your intuition is often more sensitive than your wearable; if the app says recovery is “optimal” but you feel exhausted, trust yourself (Terra Research, 2025). A wearable measures your heart's rhythm — a narrow slice. How you feel integrates sleep, mood, pain, brain fog, hormones, and the day you are having. Consumer devices also carry real error (heart rate 67–86% accurate during movement; energy estimates off by 25–28%).
4. Why they disagree — the mechanism in our data
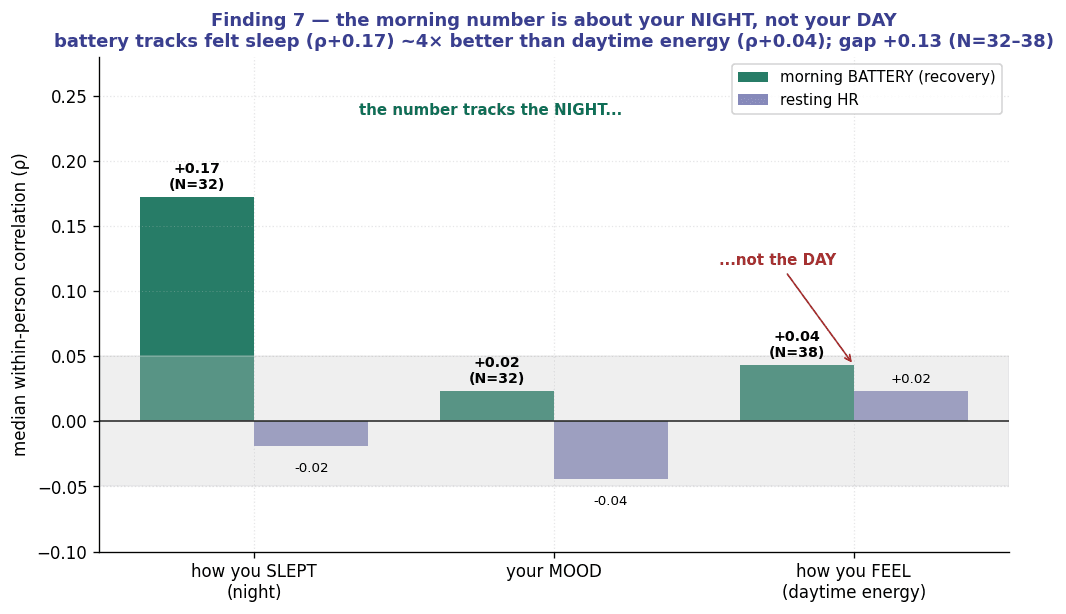
The cleanest explanation we found, and it holds across the group: the morning number is mostly about your night, not your day.
YOUR NIGHT
sleep, overnight recovery
YOUR DAY
fatigue, brain fog, pain, standing, adrenaline
the morning NUMBER
battery / recovery / HRV
which is a big part of why the number and your felt energy often disagree
5. What the number can — and cannot — do
For your next day, it confirms more than it forecasts
Finding 3 — the morning number does not 'lead' the feeling at any lag (if it forecast crashes, a 'before' bar would stand out — none does)
That said, the largest study to date (4,244 people; Aitken et al., 2026) found that a low, unstable morning HRV does carry a real same-day crash-risk signal — increases in HR and decreases in HRV in the morning was linked to a higher chance of a crash that day (specifically crashes, not general fatigue), and a within-person increase in 7-day variation for HRV, HR, and breath rate were significantly associated with an increased likelihood of a reported crash. So the number is not useless — for crashes, an unstable or dropping HRV trend combined with increased HR is worth noticing. It is just a gentle, same-day, personal signal, not a reliable next-day forecast.
High HRV can be the crash itself, not recovery
When you are crashing and lying still, your “rest-and-digest” system takes over and HRV can climb. In our data, HRV on crash days ran about 12% above each person's baseline — up, not down. So a green, high-HRV morning is not proof you are safe. (This is the same physiology as the “low HRV = risk” finding above, seen at a different moment: a low or unstable HRV is the run-up; a high HRV can be the crash).
6. The practical rule: act on the more cautious of the two
This is where the evidence becomes simple and useful. You do not need the feeling and the number to agree before you act. The established, evidence-based approach for these conditions — symptom-contingent pacing, the standard recommended by the CDC, the Bateman Horne Center, and the Workwell Foundation — is to stay inside your energy envelope and ease off whenever either signal says so.
Your body and your number disagree
Which direction
the 'great' may be stress chemistry.
a day to rest a little MORE or bank energy - not to spend a surplus
the felt need to rest is real.
'good' numbers are not a green light to push;
the device misses much of the day
Either way the safe move is the same:
act on the more cautious signal.
The disagreement is not a reason to do MORE
- A bad feeling is a valid risk signal — you act on it regardless of the data. (Yesterday's symptoms predict crashes on their own.)
- A bad, unstable data trend is also a risk signal — especially a dropping or erratic HRV.
- When they disagree, take the more cautious one. The cost is lopsided: easing off when you did not need to costs hours; pushing through when you should not have costs days or weeks.
- The number is a gentle second opinion, not a boss — and not a green light. Looking at it less is allowed, if a red score every morning becomes a source of dread.
7. It varies from person to person
For the average member, the number barely tracks their felt energy — but a minority is different. For some people a recovery or stress score genuinely flags a coming rough patch, and they rely on it. Both are valid. The honest guidance is not “ignore the app” and not “obey the app” — it is to learn your own pattern over time. The one self-check only you can run: whether “feel great → do more → crash” actually repeats for you.
8. Your cycle moves the baseline
If you menstruate, part of the month-to-month noise is hormonal and predictable. A scoping review of 40 studies found resting heart rate rises about 2.7–3.9 bpm from the follicular into the luteal phase (the ~two weeks before a period), with HRV dipping (Johnson et al., 2026). A rougher week before a period is expected — not a sign of getting worse. A red app that week may simply be reading hormones.
9. Crashes are personal, not random
In our community data, only about 1 in 6 people showed the classic “did too much yesterday → crash today” pattern. About half of crash days came from prolonged states lasting one to two weeks. The rest were triggered by illness, hormones, or stress.
Pattern A — boom-and-bust (about 1 in 6 people)
A day or two of more activity, feeling good
Crash
1-2 days later
Partial recovery
Pattern B — a prolonged state (about half of all crash days)
A trigger or build-up
Enter a crash state
Days-to-weeks in it, not just one bad day
Pattern C — trigger-driven
Infection, period, weather, stress
Crash regardless of how careful you were
10. Why there is no single answer for everyone — and why your own data still can
It is fair to ask why no app just solves this. The honest reason: researchers have tried hard and repeatedly failed to find one crash-prediction rule that fits everyone. The deepest reason is striking — the same signal means opposite things in different bodies. A rising HRV is recovery for one person and the start of a crash for another; an elevated heart rate is over-exertion for one person and ordinary dysautonomia for another. Most failed crash-prediction projects tripped over exactly this kind of person-to-person difference.
ONE rule for everyone
(e.g. 'low HRV = bad')
fails - the same signal means OPPOSITE things in different bodies
YOUR OWN baseline
(learn your normal)
flag YOUR own deviations
your data starts to match your reality
But the same research points clearly to what does work: not one rule for all, but a model built on your own baseline — learn what your normal looks like, then flag your own deviations. Within-person prediction works where between-person prediction fails (Aitken et al., 2026). Roughly 21 days of your own data is enough for personal patterns to start emerging. And some members here already read their own number well, because they have learned what it means for them.
What this guide does not claim
The science here is real and moving fast, and we have said plainly where it stops: no validated crash predictor exists for everyone; the “resting heart rate + 15 bpm” rule is unproven; the 2-day exercise test was challenged in 2026 (Mancini et al.); and our community figures come from a small, early sample that will change. The most trustworthy instrument you have is still your own pattern over time, alongside a number you read gently.
References
- 1.Aitken A, et al. (2026). Digital physiological biomarkers predict within-person symptom changes in complex chronic illness. npj Digital Medicine. article · PMC https://www.nature.com/articles/s41746-026-02543-3
- 2.Hendrix J, et al. (2024). Adrenergic dysfunction in ME/CFS and fibromyalgia: a systematic review and meta-analysis. Eur J Clin Invest 55(1):e14318. doi https://doi.org/10.1111/eci.14318
- 3.Mancini DM, et al. (2026). Cardiopulmonary exercise test results do not change over two sequential days in CFS. Front Physiol. doi https://doi.org/10.3389/fphys.2026.1816082
- 4.Johnson SC, et al. (2026). Decoding menstrual health across the lifespan. npj Women's Health. doi https://doi.org/10.1038/s44294-026-00146-7
- 5.Manresa-Rocamora A, et al. (2021). Heart rate-based indices to detect parasympathetic hyperactivity in overreached athletes. Scand J Med Sci Sports 31(6):1164–1182. doi https://doi.org/10.1111/sms.13932
- 6.Pacing / energy-envelope guidance: U.S. CDC ME/CFS clinical care; Bateman Horne Center criteria-specific guidance; Workwell Foundation heart-rate pacing (symptom-contingent pacing as standard of care).
- 7.Naviaux RK, et al. (2016). Metabolic features of chronic fatigue syndrome. PNAS 113(37). doi https://doi.org/10.1073/pnas.1607571113
- 8.Terra Research (2025). Wearable signals vs. premenstrual symptoms (industry analysis, ~2.5M records).
- 9.ELC Community internal analysis (June 2026) — figures 1–4. Each person compared only to themselves; aggregates only where 11+ members contribute. Early data, will update.